Vector Spherical Harmonics Representation of Antennas
from pylayers.antprop.antenna import *

from pylayers.antprop.antvsh import *

%matplotlib inline
Loading an Antenna from a Matlab file
A = Antenna('S2R2.mat',directory='ant/UWBAN/Matfile')
The shape of the \(F_{\phi}\) functions indicates :
\(N_{\theta} = 91\)
:math:`N_{phi} = 180 `
\(N_f= 104\)
np.shape(A.Fp)
(91, 180, 104)
The frequency array is expressed in \(GHz\) and delays are expressed in \(ns\)
fGHz = A.fGHz
fGHz.shape
(104,)
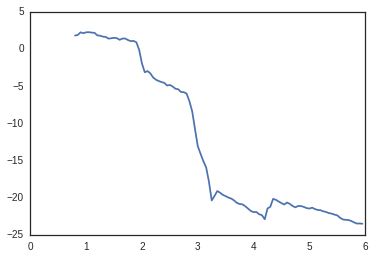
Then an electrical delay of \(4.185ns\) is applied on the \(F_{\theta}\)
I = A.Ft[:,:,:]
I.shape
(91, 180, 104)
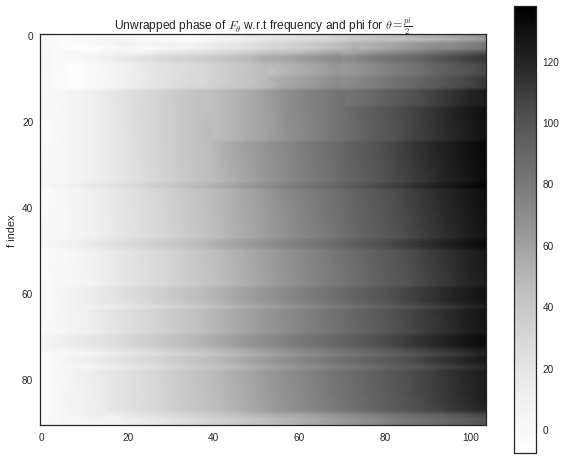
plt.figure(figsize=(10,8))
plt.imshow(np.unwrap(np.angle(I[:,45,:])))
plt.title(r'Unwrapped phase of $F_{\theta}$ w.r.t frequency and phi for $\theta=\frac{pi}{2}$')
plt.ylabel('f index')
plt.colorbar()
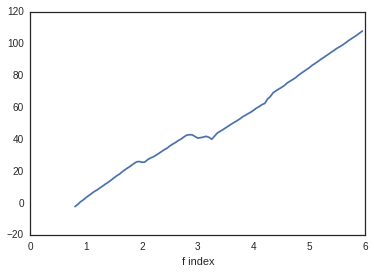
plt.figure()
plt.plot(fGHz,np.unwrap(np.angle(I[45,85,:])))
plt.xlabel('f index')
<matplotlib.text.Text at 0x7f595f38dad0>
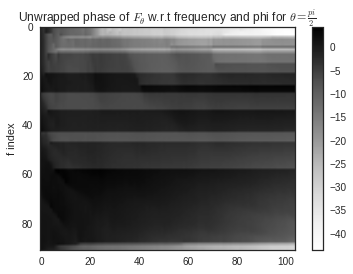
tau=4.185

I = A.Ft[:,:,:]*np.exp(-2*1j*np.pi*fGHz[None,None,:]*tau)
plt.imshow(np.unwrap(np.angle(I[:,45,:])))

plt.title(r'Unwrapped phase of $F_{\theta}$ w.r.t frequency and phi for $\theta=\frac{pi}{2}$')

plt.ylabel('f index')

plt.colorbar()

plt.figure()

plt.plot(fGHz,np.unwrap(np.angle(I[45,85,:])))
[<matplotlib.lines.Line2D at 0x7f595efcf710>]
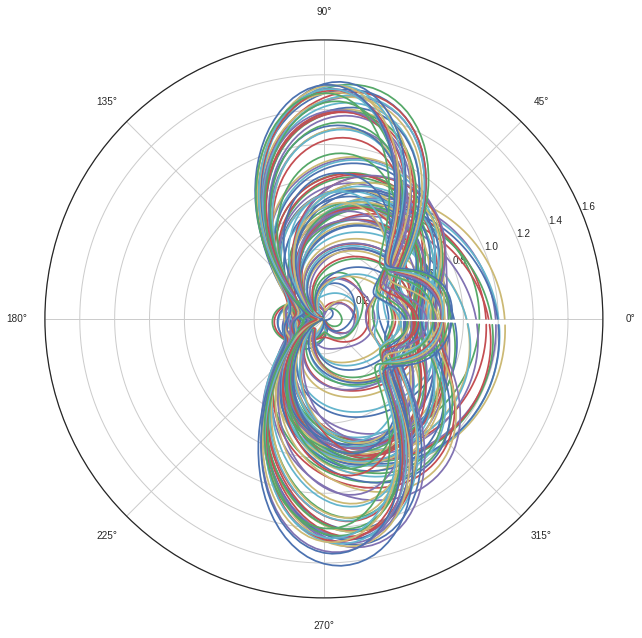
Display of the radiation pattern for all frequencies
plt.figure(figsize=(10,10))

for nf in range(104):
    plt.polar(A.phi,abs(A.Ft[45,:,nf]))
A.info()
S2R2.mat
type :  mat
S2R2
Th1
04/13/12
09:59


2
2
Nb theta (lat) : 91
Nb phi (lon) : 180
No vsh coefficient calculated yet
Evaluation of Vector Spherical Harmonics Coefficients
At that stage we compute the Vector Spherical Harmonics coefficients
A=vsh(A)
A.info()
S2R2.mat
type :  mat
S2R2
Th1
04/13/12
09:59


2
2
Nb theta (lat) : 91
Nb phi (lon) : 180
No vsh coefficient calculated yet
A.C.s1tos2(30)
A.C
Br
-------------
L1  : 90
M1  : 89
Ncoeff s1 8010
NCoeff s2  : 495

Bi
-------------
L1  : 90
M1  : 89
Ncoeff s1 8010
NCoeff s2  : 495

Cr
-------------
L1  : 90
M1  : 89
Ncoeff s1 8010
NCoeff s2  : 495

Ci
-------------
L1  : 90
M1  : 89
Ncoeff s1 8010
NCoeff s2  : 495
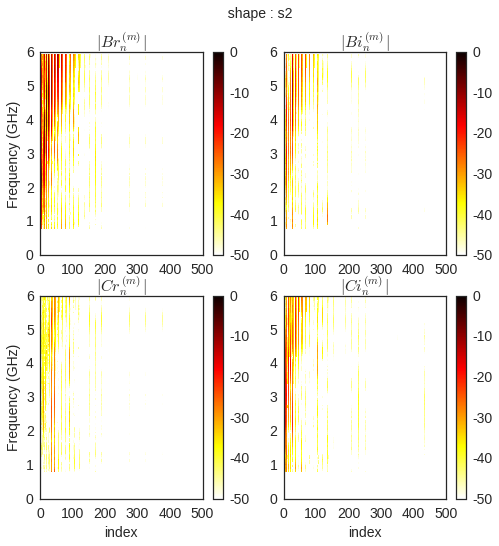
fig = plt.figure(figsize=(8,8))

A.C.show('s2',k=300)
A.C.s2tos3()
A.C
Br
-------------
L1  : 90
M1  : 89
Ncoeff s1 8010
NCoeff s2  : 495
Ncoeff s3 : 145

Bi
-------------
L1  : 90
M1  : 89
Ncoeff s1 8010
NCoeff s2  : 495
Ncoeff s3 : 145

Cr
-------------
L1  : 90
M1  : 89
Ncoeff s1 8010
NCoeff s2  : 495
Ncoeff s3 : 145

Ci
-------------
L1  : 90
M1  : 89
Ncoeff s1 8010
NCoeff s2  : 495
Ncoeff s3 : 145
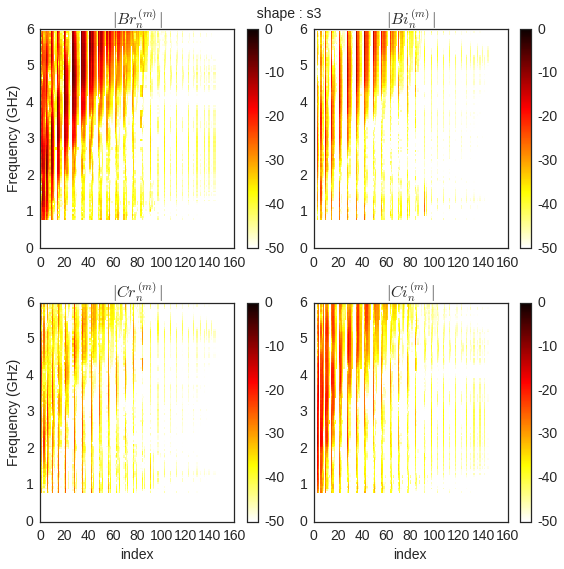
fig = plt.figure(figsize=(8,8))

A.C.show('s3')

plt.tight_layout()