Scalar Spherical Harmonics
from pylayers.antprop.antenna import *
from pylayers.antprop.antssh import *
%matplotlib inline
A = Antenna('S1R1.mat',directory='ant/UWBAN/Matfile')
A
Antenna type : mat
------------------------
------------------------
file name : S1R1.mat
fmin : 0.80GHz
fmax : 5.95GHz
step : 50.00MHz
Nf : 104
-----------------------
      evaluated
-----------------------
Ntheta : 91
Nphi : 180
   f = 5.60 GHz
   theta = 70.00 (degrees)
   phi = 272.00  (degrees)
A.nf
104
To calculate scalar spherical harmonics use method ssh(A,L)
L = 5
A = ssh(A,L=5)
A
Antenna type : mat
------------------------
------------------------
file name : S1R1.mat
fmin : 0.80GHz
fmax : 5.95GHz
step : 50.00MHz
Nf : 104
-----------------------
      evaluated
-----------------------
Ntheta : 91
Nphi : 180
   f = 5.60 GHz
   theta = 70.00 (degrees)
   phi = 272.00  (degrees)
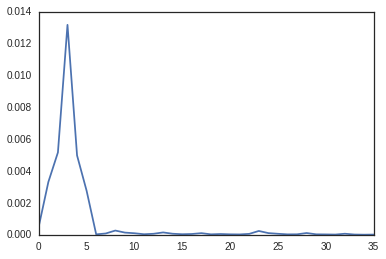
plt.plot(abs(A.S.Cx.s2[0]))
[<matplotlib.lines.Line2D at 0x7fa3235ed210>]
A.savesh2()
/home/uguen/Bureau/P1/ant/S1R1.sh2 already exist
A.loadsh2()
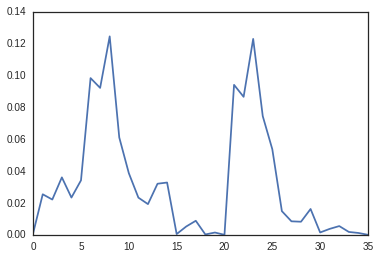
plt.plot(abs(A.S.Cx.s2[0]))
[<matplotlib.lines.Line2D at 0x7fa3234ec1d0>]
A.S.s2tos3()
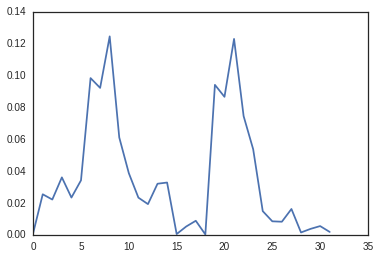
plt.plot(abs(A.S.Cx.s3[0]))
[<matplotlib.lines.Line2D at 0x7fa32342ae10>]
A.S.Cx.ind2.shape
(36, 2)
A.savesh3()
/home/uguen/Bureau/P1/ant/S1R1.sh3 already exist
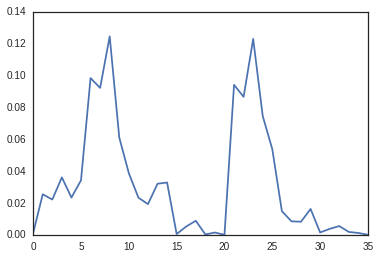
plt.plot(abs(A.S.Cx.s2[0]))
[<matplotlib.lines.Line2D at 0x7fa323372190>]
A.loadsh3()
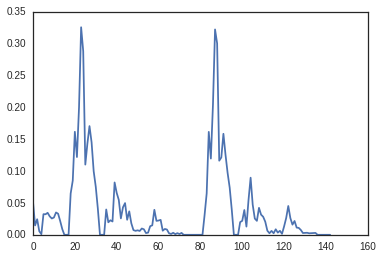
plt.plot(abs(A.S.Cx.s3[100]))
[<matplotlib.lines.Line2D at 0x7fa3232ac150>]
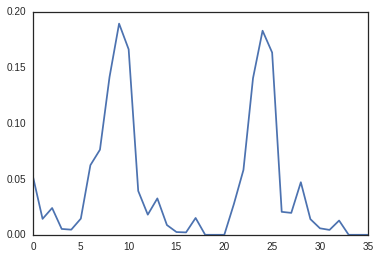
plt.plot(abs(A.S.Cx.s2[100]))
[<matplotlib.lines.Line2D at 0x7fa3231f4410>]
A.__dict__.keys()
['tau',
 '_is_selected',
 'PhotoFile',
 'nf',
 'full_evaluated',
 'Fp',
 'Run',
 'source',
 '_filename',
 'param',
 'Serie',
 'Date',
 'theta',
 'fromfile',
 'fGHz',
 'phi',
 'nph',
 'Notes',
 'nth',
 'S',
 'AntennaName',
 'grid',
 'Ft',
 'typ',
 'DataFile',
 'evaluated',
 'ext',
 'StartTime',
 'sqG']
A.S.Cx.__dict__.keys()
['k2', 'ind3', 'ind2', 'fmax', 's2', 'Nf', 's3', 'lmax', 'fmin']
A.S.Cx
Nf   : 104
fmin (GHz) : 0.8
fmax (GHz) : 5.95
NCoeff s2  : 36
Ncoeff s3 : 143