UWB Ray tracing simulation in outdoor scenario
Example taken from Joseph W. Schuster, R.J Luebbers [Techniques for Evaluating the Accuracy of Ray-Tracing Propagation Models for Microcells](http://tinyurl.com/z2plo2v)
Out:
Warning Unable to read graph Gr
Warning Unable to read graph Gw
Layout Graph loaded
from pylayers.simul.link import *
import matplotlib.cm as cm
L = Layout('Luebbers.lay',bbuild=1)
#ax = fig.add_subplot(2,2,1)
#fig,ax = L._visual_check(fig=fig,ax=ax)
#L.build()
# Creating a Link
DL=DLink(L=L)
DL.fGHz= np.array([0.9])
#DL.a = np.array(([25,21.67,2.]))
DL.a = np.array(([37.5,5.,2.]))
DL.b = np.array(([12.5,30.,2.]))
#
# Set the antennas
#
DL.Aa=Antenna(typ='Omni')
DL.Ab=Antenna(typ='Omni')
#DL.show()
#
# Link evaluation
#
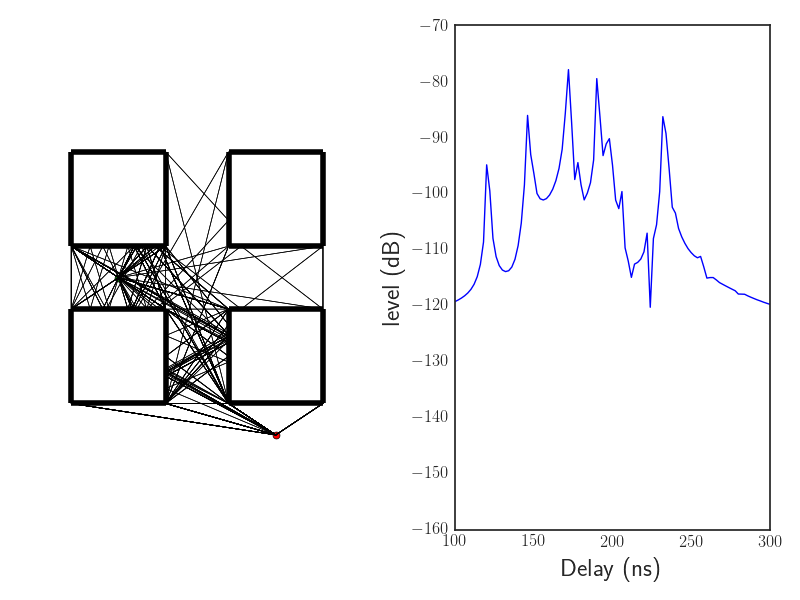
DL.eval(force=1,cutoff=3,threshold=0.1,diffraction=1,nD=2)
fig = plt.figure()
ax1 = fig.add_subplot(121)
DL.R.show(L=DL.L,fig=fig,ax=ax1)
cir = DL.H.getcir(BWGHz=0.5,Nf=10000)
ax2 = fig.add_subplot(122)
ax2.plot(cir.x,20*np.log10(np.abs(cir.y[0,0,:])))
for tick in ax2.xaxis.get_major_ticks():
tick.label.set_fontsize=26
for tick in ax2.yaxis.get_major_ticks():
tick.label.set_fontsize=26
ax2.set_xlim(100,300)
ax2.set_xlabel('Delay (ns)',fontsize=18)
ax2.set_ylabel('level (dB)',fontsize=18)
#plt.ylim(-200,-50)
fig.tight_layout()
plt.show()
Total running time of the script: ( 1 minutes 8.145 seconds)