Building graphs of a Layout
from pylayers.gis.layout import *
# Load the layout from its .ini file in $BASENAME/struc/ini
L = Layout('WHERE1.lay')
# Build all the graphs
L.build()
# Check graphs
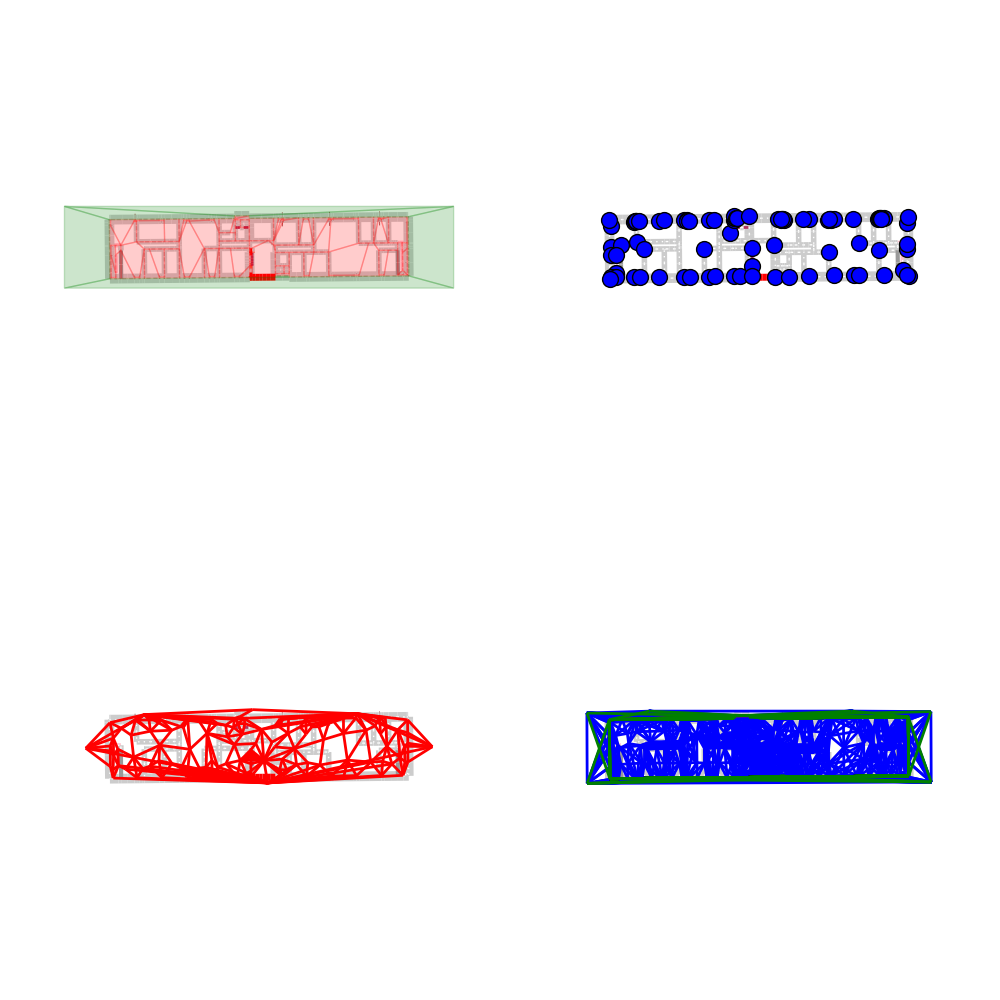
L._visual_check()
plt.show()
Total running time of the script: (0 minutes 17.833 seconds)
Download Python source code: plot_exLayout2.py
Download IPython notebook: plot_exLayout2.ipynb