Indoor Radio Coverage FP7 WHERE1 M1 setup
Out:
Warning : imposm seems not to be installed
Warning Unable to read graph Gr
Warning Unable to read graph Gw
from pylayers.antprop.coverage import *
import matplotlib.pyplot as plt
C = Coverage('where1cov.ini')
C.cover()
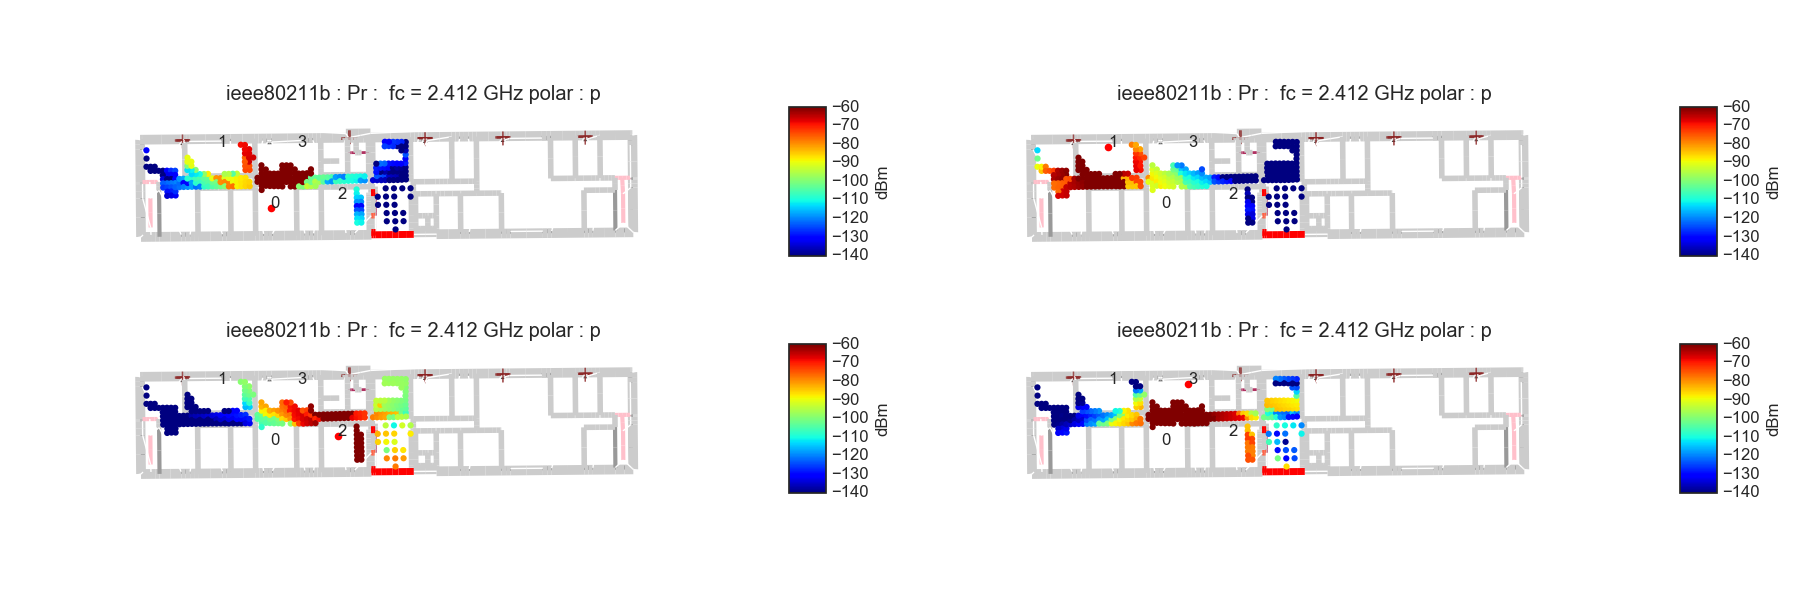
fig = plt.figure(figsize=(18,6))
ax=fig.add_subplot(221)
f,a = C.show(fig=fig,ax=ax,typ='pr',a=0,vmin=-140,vmax=-60)
ax = fig.add_subplot(222)
f,a = C.show(fig=fig,ax=ax,typ='pr',a=1,vmin=-140,vmax=-60)
ax = fig.add_subplot(223)
f,a = C.show(fig=fig,ax=ax,typ='pr',a=2,vmin=-140,vmax=-60)
ax = fig.add_subplot(224)
f,a = C.show(fig=fig,ax=ax,typ='pr',a=3,vmin=-140,vmax=-60)
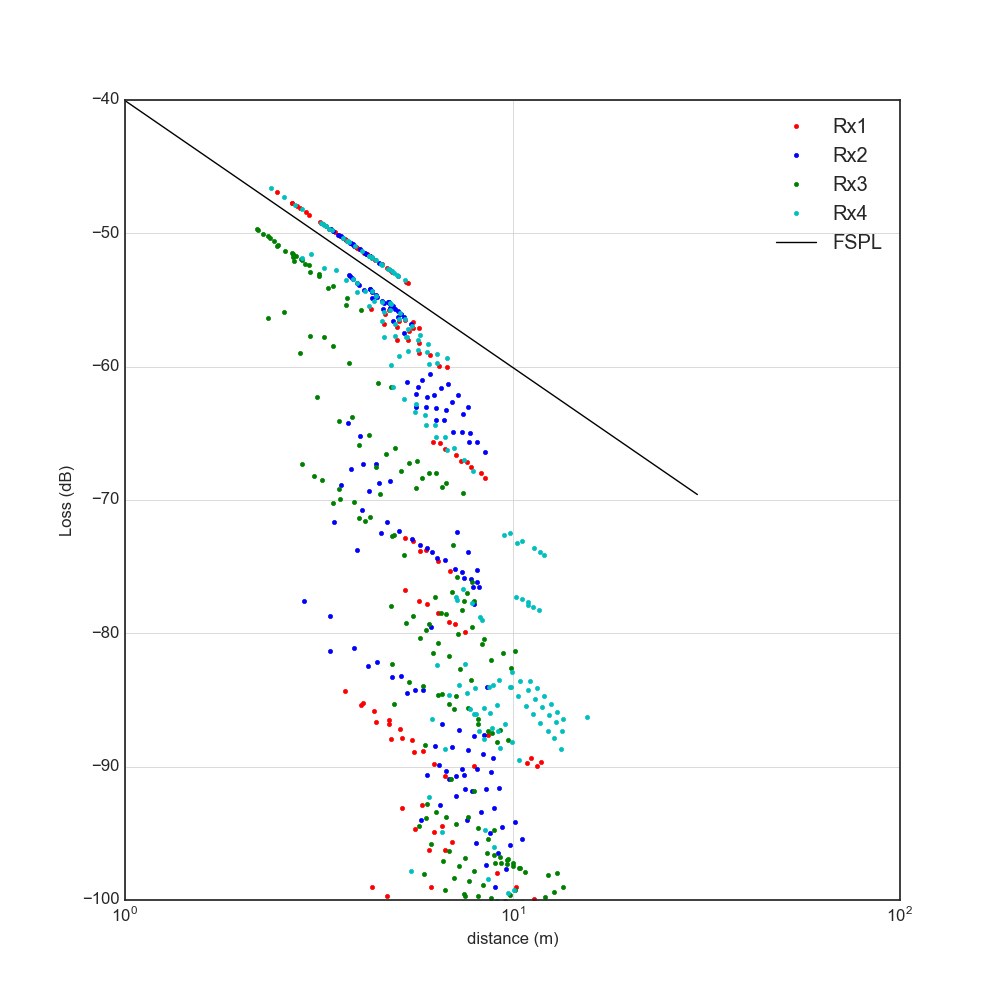
fig = plt.figure(figsize=(10,10))
fig,ax = C.plot(a=0,fig=fig,col='r',label='Rx1')
fig,ax = C.plot(a=1,fig=fig,col='b',label='Rx2')
fig,ax = C.plot(a=2,fig=fig,col='g',label='Rx3')
fig,ax = C.plot(a=3,fig=fig,col='c',label='Rx4')
d = np.linspace(1,30,100)
LFS = -(32.4+20*np.log10(2.412)+20*np.log10(d))
ax.semilogx(d,LFS,color='k',label='FSPL')
ax.legend()
plt.xlabel('distance (m)')
plt.ylabel('Loss (dB)')
plt.ylim(-100,-40)
plt.grid()
plt.show()
Total running time of the script: ( 0 minutes 11.674 seconds)