TBsignal
-
class
pylayers.signal.bsignal.TBsignal(x=array([], dtype=float64), y=array([], dtype=float64), label=[])[source]¶ Bases:
pylayers.signal.bsignal.BsignalBased signal in Time domain
Methods Summary
b2tu(N)conversion from TBsignal to TUsignal
b2tu2(fsGHz, Tobsns)conversion from TBsignal to TUsignal
integ(Tns[, Tsns])integation of alphak tauk of TBsignal
plot(**kwargs)plot TBsignal
tap(fcGHz, WGHz, Ntap)Back to baseband
translate(tau)translate TBsignal signal by tau
Methods Documentation
-
b2tu(N)[source]¶ conversion from TBsignal to TUsignal
- Ninteger
Number of points
U : TUsignal
This function exploits linear interp1d
>>> from pylayers.signal.bsignal import *
>>> import matplotlib.pyplot as plt
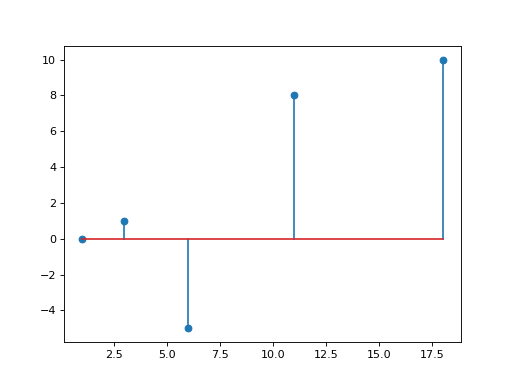
>>> x = np.array( [ 1, 3 , 6 , 11 , 18])
>>> y = np.array( [ 0,1 ,-5, 8 , 10])
>>> sb = TBsignal(x,y)
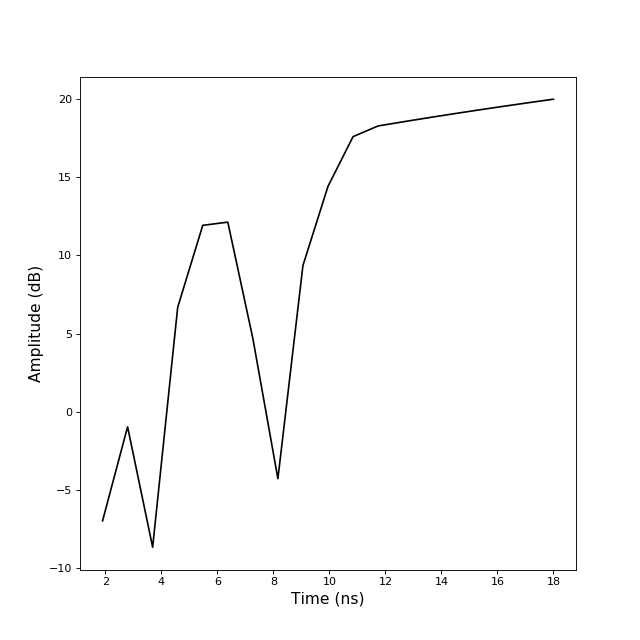
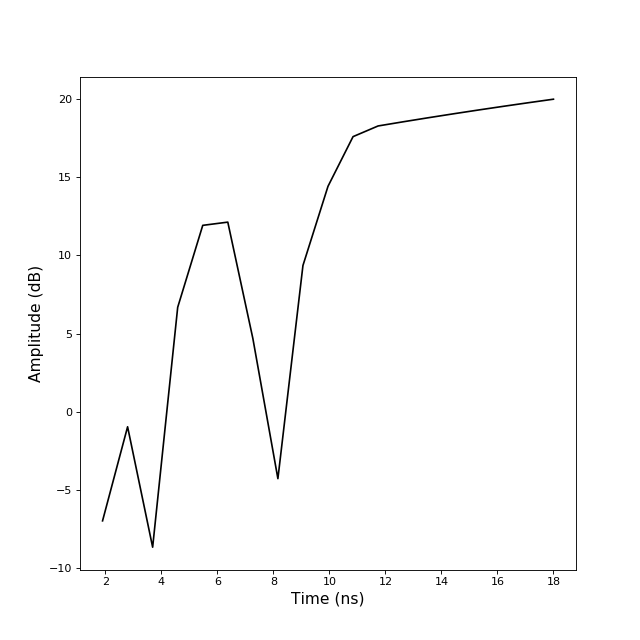
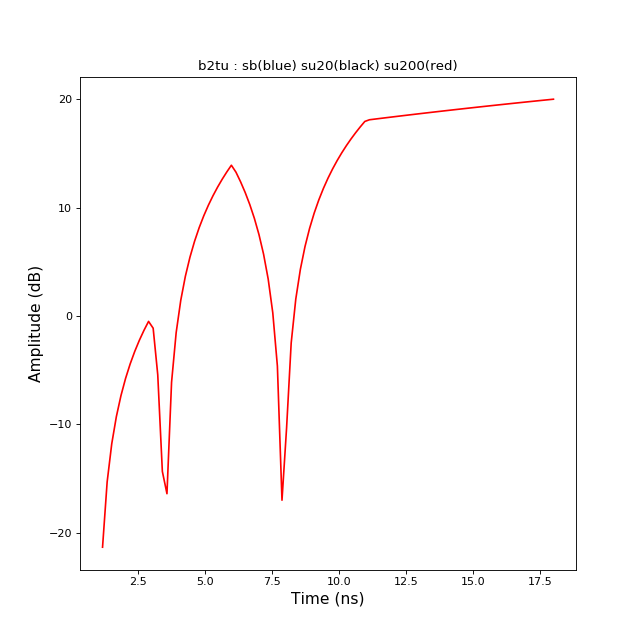
>>> su20 = sb.b2tu(20)
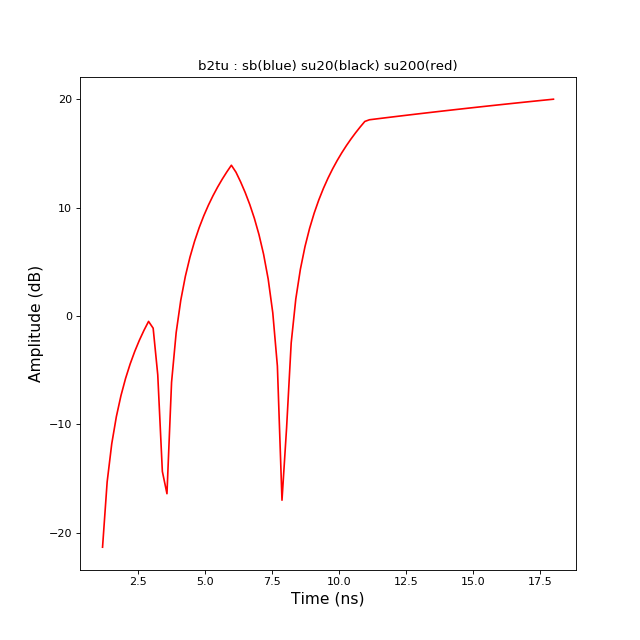
>>> su100 = sb.b2tu(100)
>>> fi = plt.figure()
>>> st = sb.stem()
>>> fig,ax = su20.plot(color='k')
>>> fig,ax = su100.plot(color='r')
>>> ti = plt.title('b2tu : sb(blue) su20(black) su200(red)')
-
b2tu2(fsGHz, Tobsns)[source]¶ conversion from TBsignal to TUsignal
- Ninteger
Number of points
U : TUsignal
This function exploits linear interp1d
>>> from pylayers.signal.bsignal import *
>>> import matplotlib.pyplot as plt
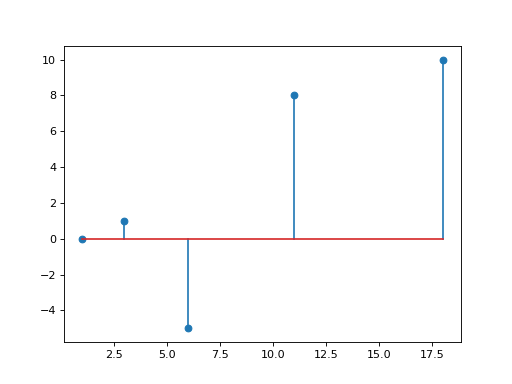
>>> x = np.array( [ 1, 3 , 6 , 11 , 18])
>>> y = np.array( [ 0,1 ,-5, 8 , 10])
>>> sb = TBsignal(x,y)
>>> su20 = sb.b2tu(20)
>>> su100 = sb.b2tu(100)
>>> fi = plt.figure()
>>> st = sb.stem()
>>> fig,ax = su20.plot(color='k')
>>> fig,ax = su100.plot(color='r')
>>> ti = plt.title('b2tu : sb(blue) su20(black) su200(red)')
-
integ(Tns, Tsns=50)[source]¶ integation of alphak tauk of TBsignal
used energy detector for IEEE 802.15.6 standard
Tns : Tsns :
-
plot(**kwargs)[source]¶ plot TBsignal
unit1 : actual unit of data unit2 : unit for display dist : boolean xmin : float xmax : float logx : boolean logy :boolean
>>> import numpy as np
>>> from pylayers.signal.bsignal import *
>>> from matplotlib.pylab import *
>>> x = np.array( [ 1, 3 , 6 , 11 , 18])
>>> y = np.array( [ 0,1 ,-5, 8 , 10])
>>> s = Bsignal(x,y)
>>> fi = figure()
>>> fig,ax=s.plot(typ=['v'])
>>> ti = title('TBsignal : plot')
>>> show()
-
tap(fcGHz, WGHz, Ntap)[source]¶ Back to baseband
- fcGHzfloat
center frequency
- WGHzfloat
bandwidth
- Ntapint
Number of tap
Implement formula (2.52) from D.Tse book page 50
-
translate(tau)[source]¶ translate TBsignal signal by tau
- taufloat
delay for translation
Once translated original signal and translated signal might not be on the same grid
>>> from pylayers.signal.bsignal import *
>>> from matplotlib.pylab import *
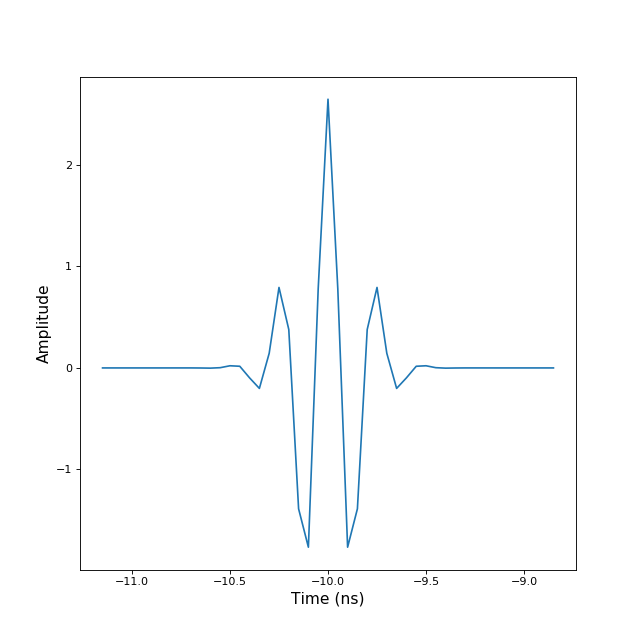
>>> ip = TUsignal()
>>> ip.EnImpulse()
>>> ip.translate(-10)
>>> fig,ax=ip.plot(typ=['v'])
>>> show()
-

