Bsignal
-
class
pylayers.signal.bsignal.Bsignal(x=array([], dtype=float64), y=array([], dtype=float64), label=[])[source]¶ Bases:
pylayers.util.project.PyLayersSignal with an embedded time base
This class gathers a 1D signal and its axis indexation.
The x base is not necessarily uniform
x has 1 axis
x and the last axes of y have the same length
By construction shape(y)[-1] :=len(x), len(x) takes priority in case of observed conflict
Methods Summary
append(bs)append bs to Bsignal
cformat(**kwargs)complex format
extract(u)extract a subset of signal from index
flatteny([yrange, reversible])flatten y array
gating(xmin, xmax)gating between xmin and xmax
imshow(**kwargs)imshow of y matrix
len()returm length of x axis
load(filename)load a Bsignal from a Matlab File
max()max value of the signal (module if complex)
mean()mean value of the signal
min()min value of the signal (module if complex)
plot(**kwargs)plot signal Bsignal
save(filename)save Bsignal in Matlab File Format
setx(x)setx : set x vector
sety(fun)sety : set y vector
stem(**kwargs)stem display
step([color])plot steps display
Methods Documentation
-
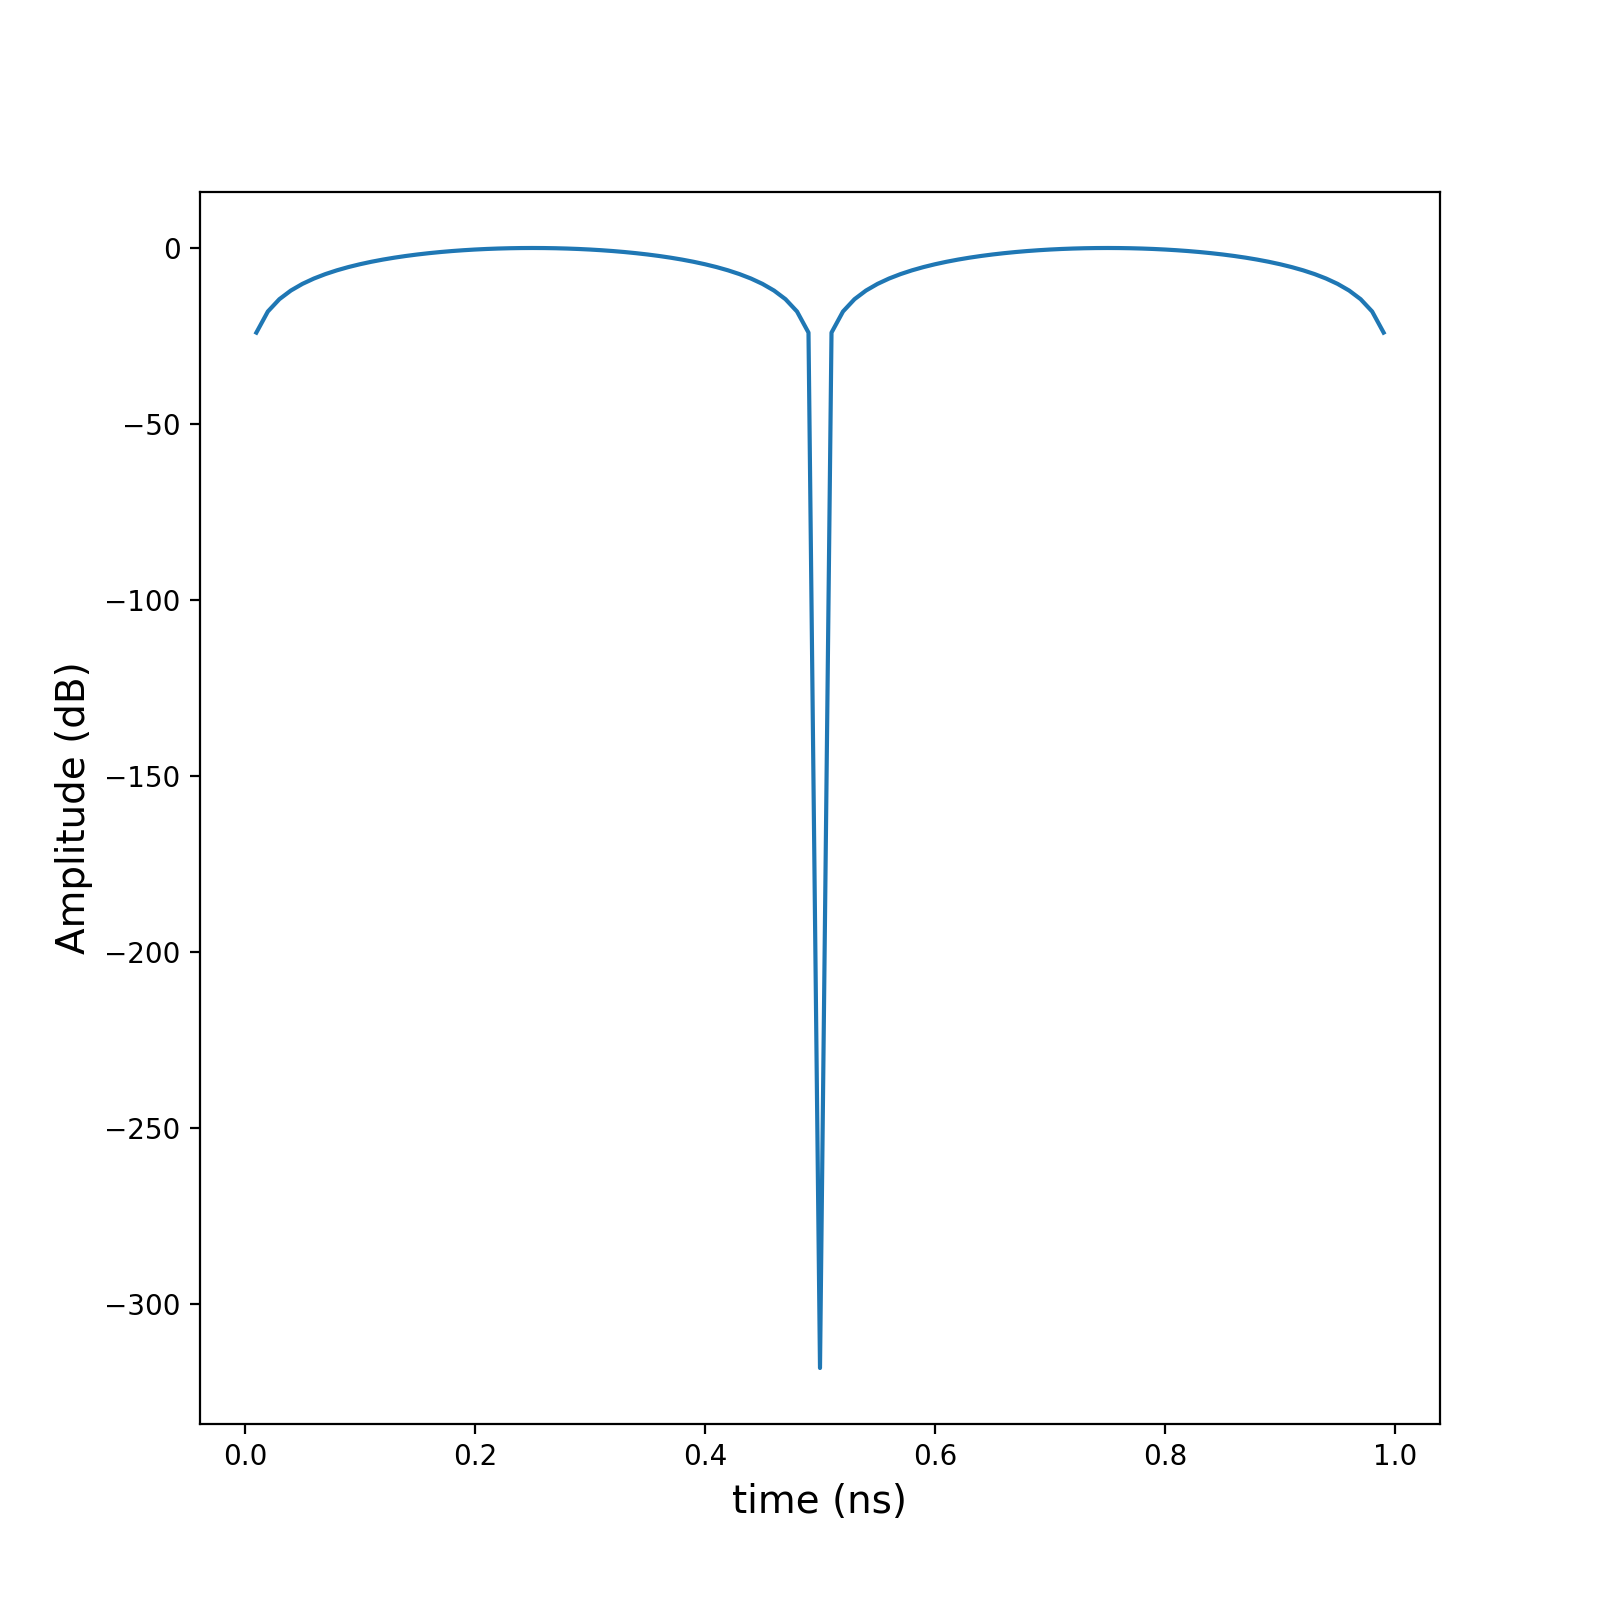
cformat(**kwargs)[source]¶ complex format
- saxlist
selected output axis from y default [0,1] typ : string ‘m’ : modulus ‘v’ : value ‘l10’ : dB (10 log10) ‘l20’ : dB (20 log10) ‘d’ : phase degrees ‘r’ : phase radians ‘du’ : phase degrees unwrap ‘ru’ : phase radians unwrap ‘gdn’ : group delay (ns) ‘gdm’ : group distance (m) ‘re’ : real part ‘im’ : imaginary part
- sellist of ndarray()
data selection along selected axis, all the axis void default [[],[]]
ik : fixed axis value default (0)
- a0first data axis
this axis can be self.x or not
a1 : second data axis dt : data
- ylabelsstring
label for the selected complex data format
This function returns 2 arrays x and y and the corresponding labels Convention : the last axis of y has same dimension as x y can have an arbitrary number of axis i.e a MIMO channel matrix could be x : f and y : t x r x f
>>> import numpy as np
>>> S = Bsignal()
>>> x = np.arange(100)
>>> y = np.arange(400).reshape(2,2,100)+1j*np.arange(400).reshape(2,2,100)
>>> S.x = x
>>> S.y = y
>>> S.cformat()
(array([[-240.        ,   43.01029996],
       [  49.03089987,   52.55272505]]), 'Magnitude (dB)')
-
extract(u)[source]¶ extract a subset of signal from index
u : np.array
O : Usignal
>>> from pylayers.signal.bsignal import *
>>> import numpy as np
>>> x = np.arange(0,1,0.01)
>>> y = np.sin(2*np.pi*x)
>>> s = Bsignal(x,y)
>>> su = s.extract(np.arange(4,20))
>>> f,a = s.plot()
>>> f,a = su.plot()
-
flatteny(yrange=[], reversible=False)[source]¶ flatten y array
yrange : array of y index values to be flattenned reversible : boolean
if True the sum is place in object member yf else y is smashed
-
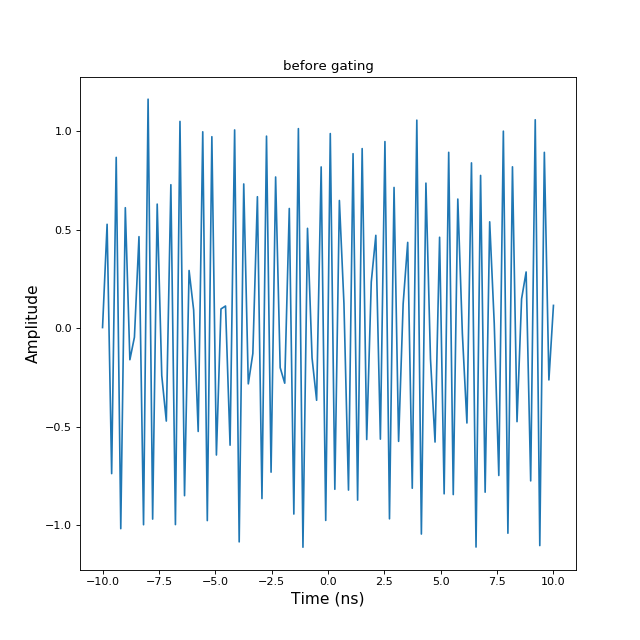
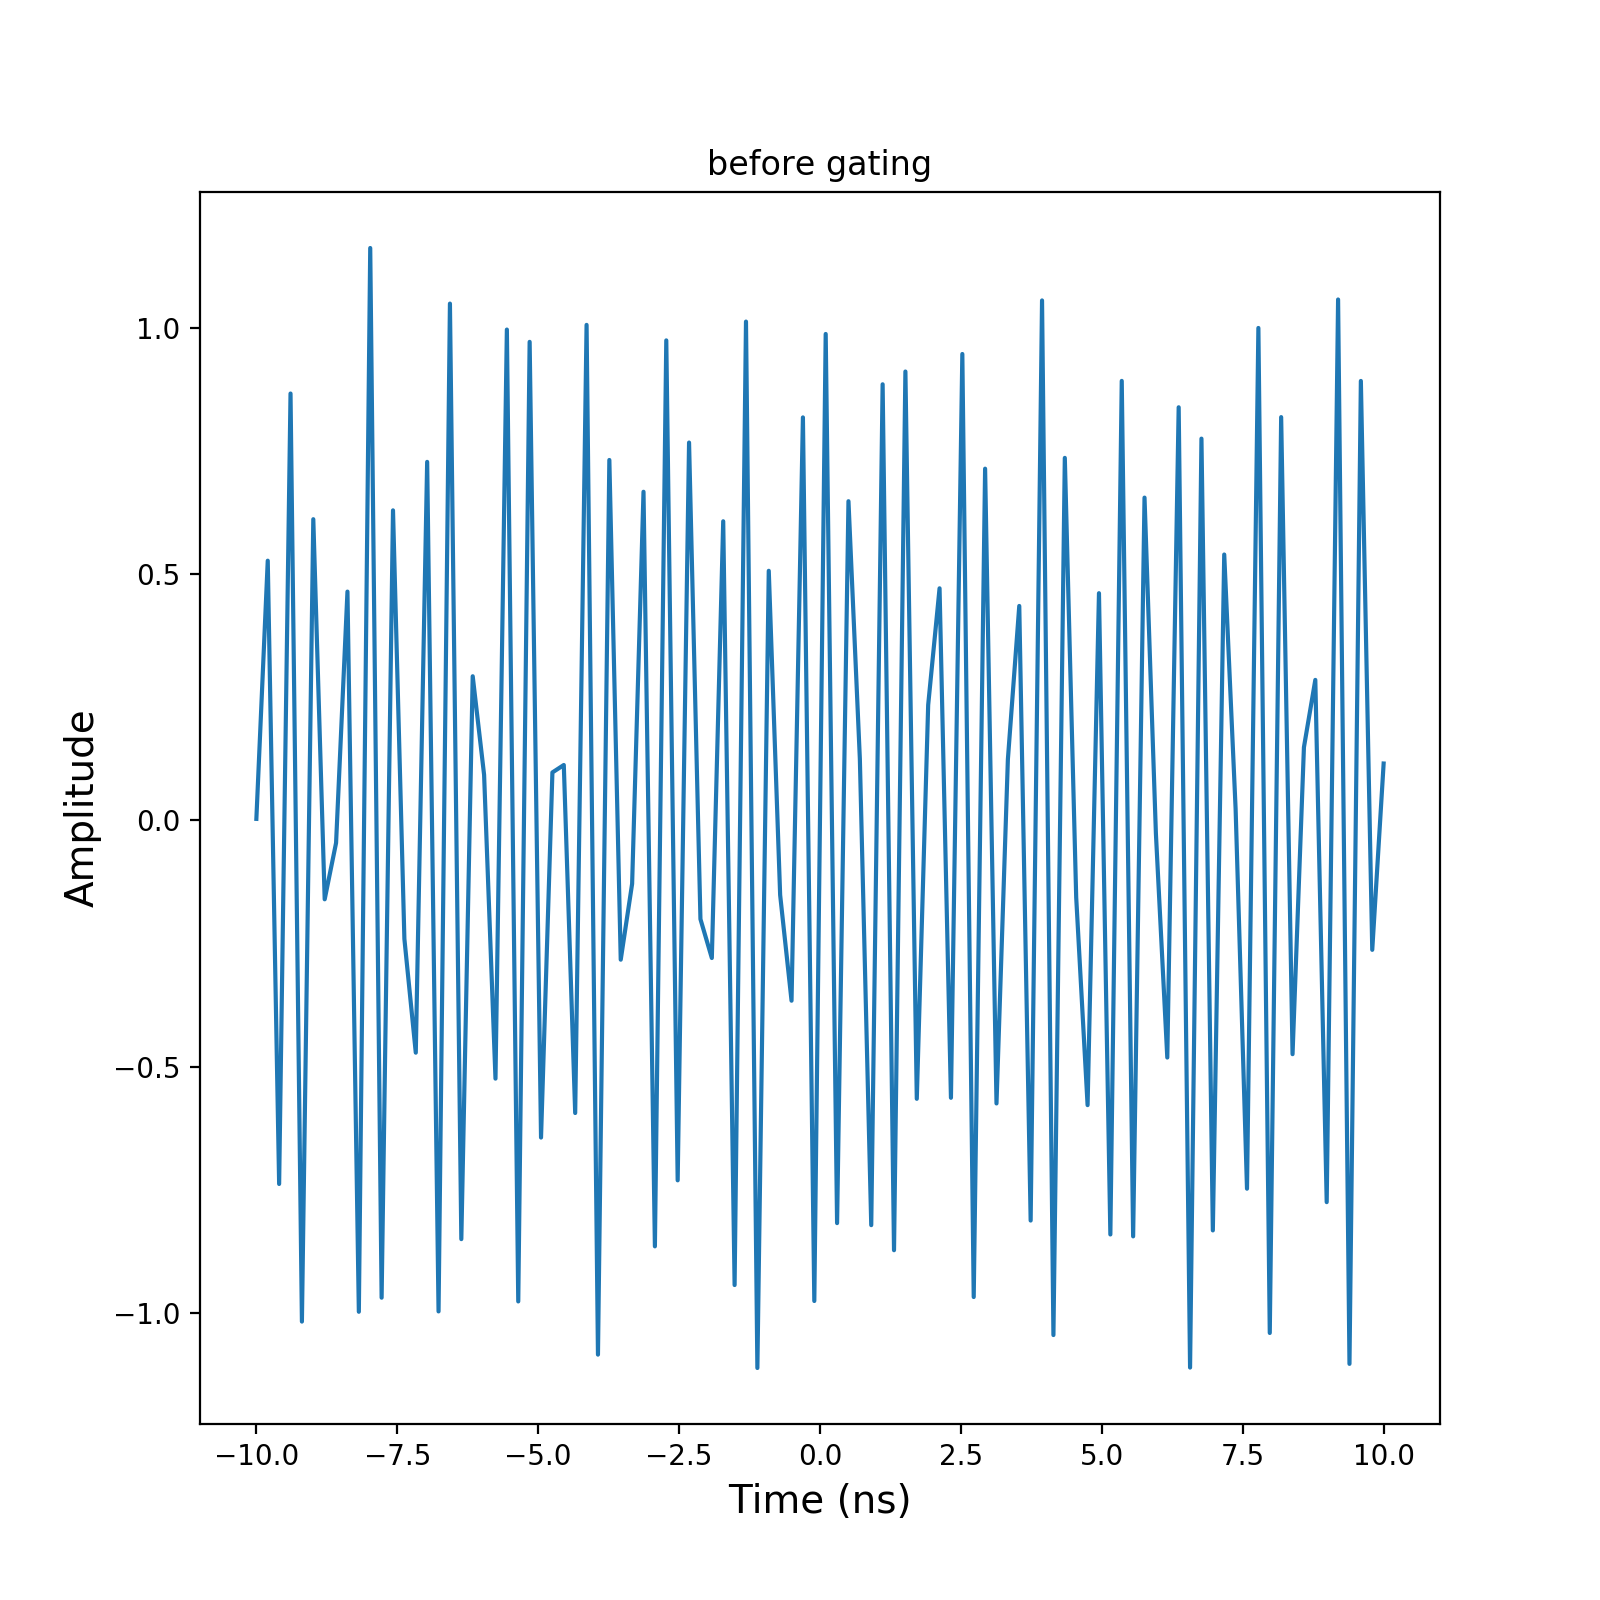
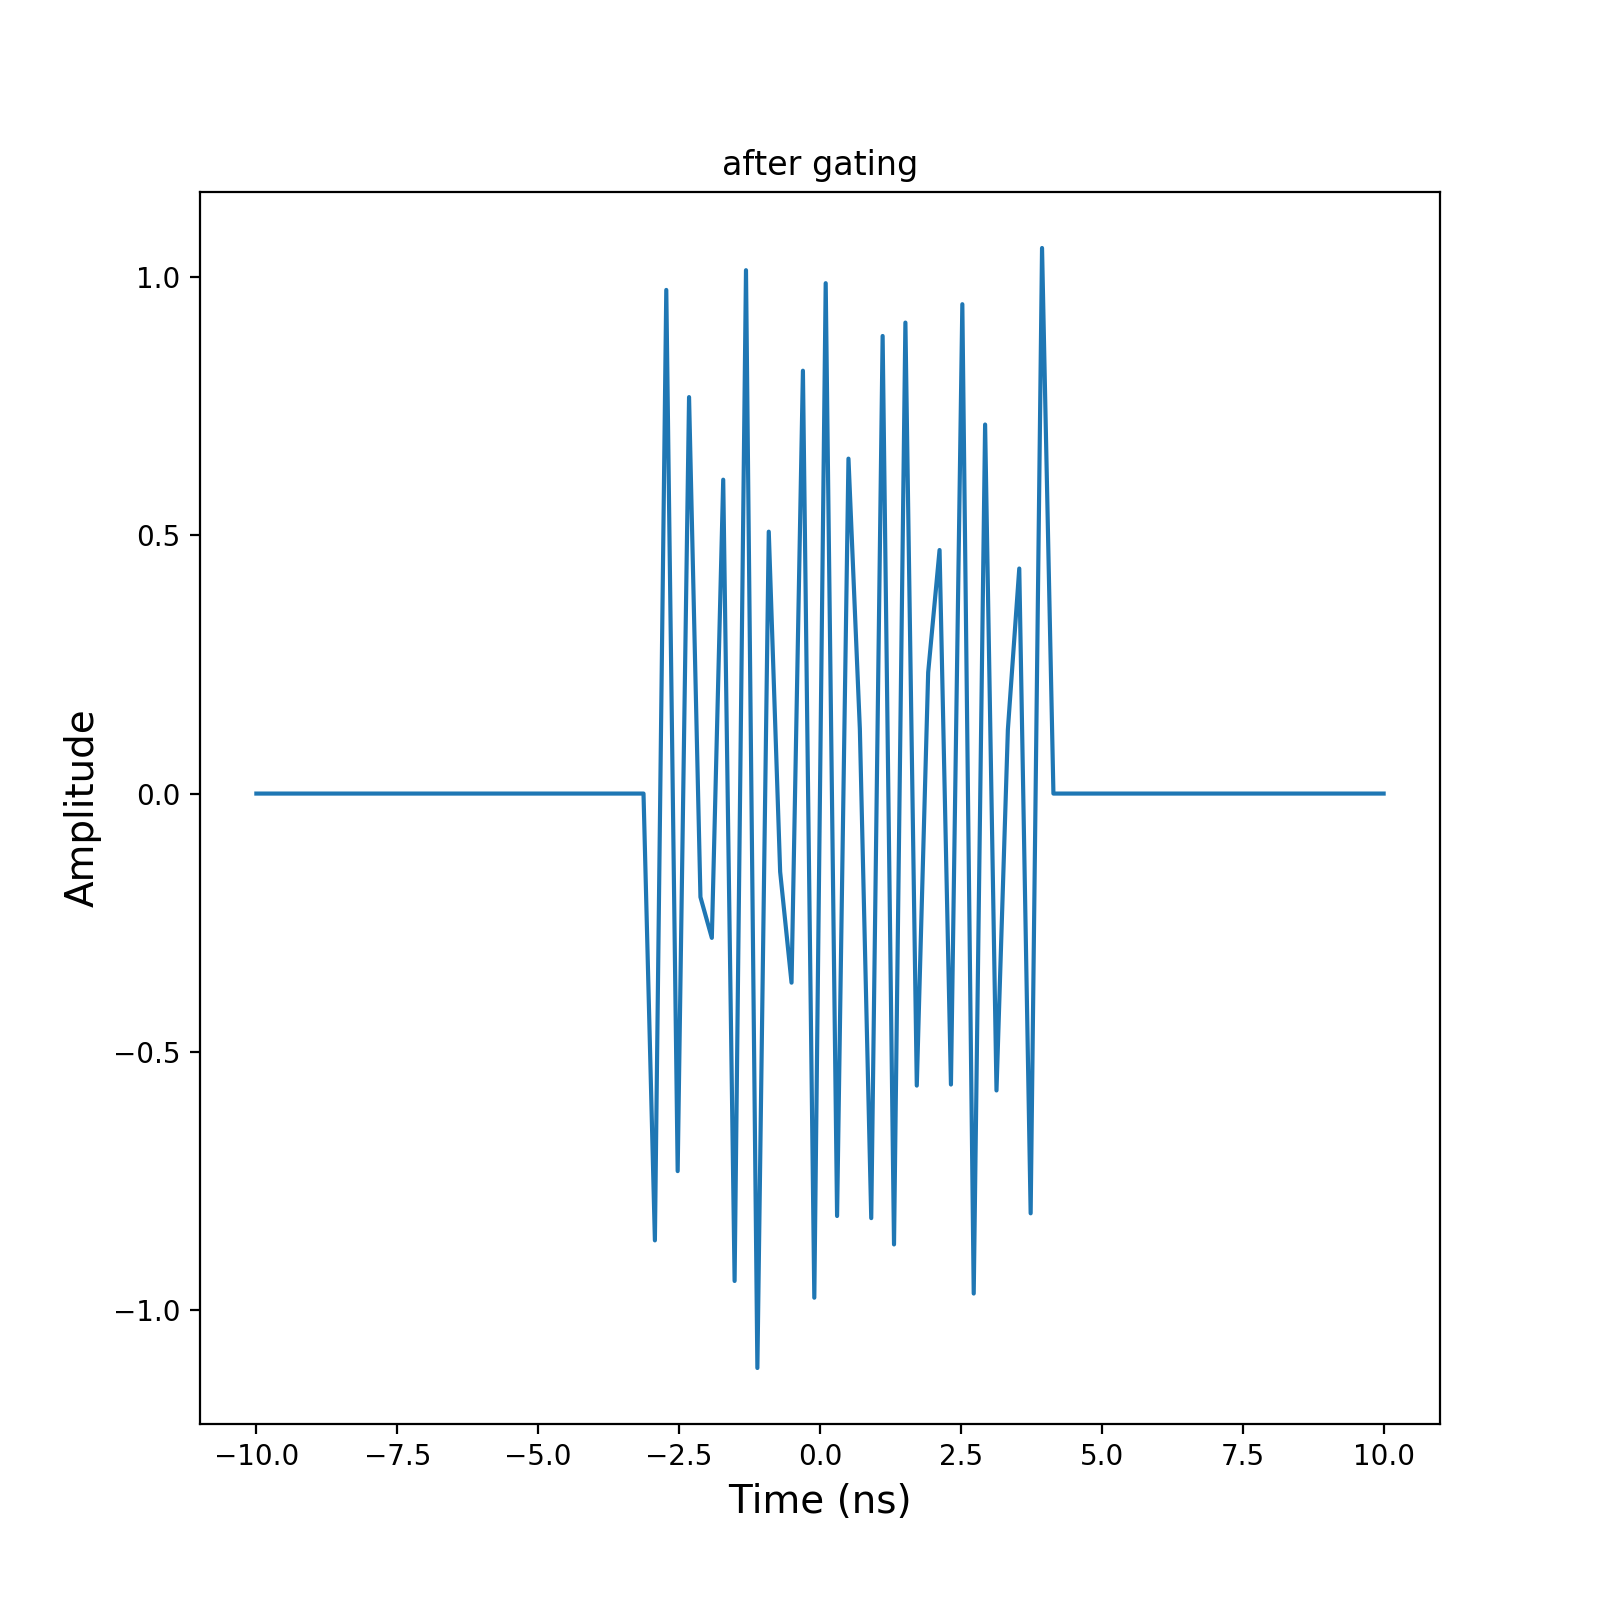
gating(xmin, xmax)[source]¶ gating between xmin and xmax
xmin : float xmax : float
nothing self is modified
>>> import numpy as np
>>> import matplotlib.pyplot as plt
>>> from pylayers.signal.bsignal import *
>>> x = np.linspace(-10,10,100)
>>> y = np.sin(2*np.pi*12*x)+np.random.normal(0,0.1,len(x))
>>> s = TUsignal(x,y)
>>> fig,ax = s.plot(typ=['v'])
>>> txt1 = plt.title('before gating')
>>> plt.show()
(Source code, png, hires.png, pdf)
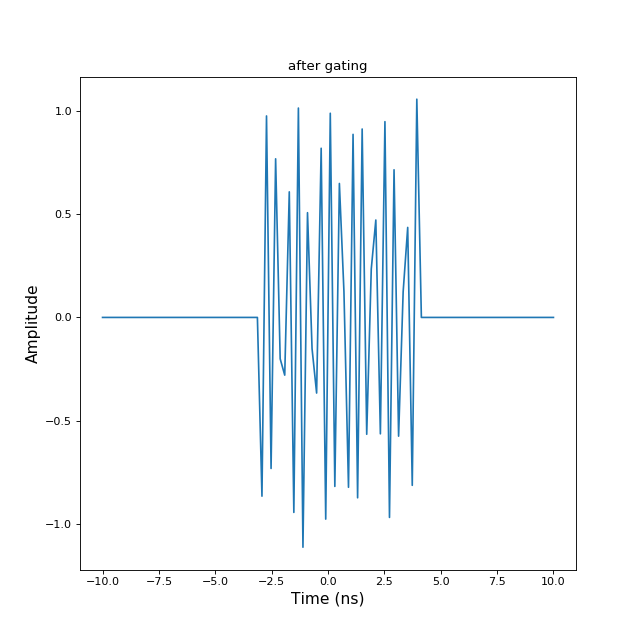
>>> s.gating(-3,4)
>>> fig,ax=s.plot(typ=['v'])
>>> txt2 = plt.title('after gating')
>>> plt.show()

When a gating is applied the removed information is lost
-
imshow(**kwargs)[source]¶ imshow of y matrix
- interpolationstring
‘none’|’nearest’|’bilinear’
- cmapcolormap
plt.cm.jet
- aspectstring
‘auto’ (default) ,’equal’,’scalar’
- functionstring
{‘imshow’|’pcolormesh’}
- typstring
‘l20’,’l10’
vmin : min value vmax : max value sax : list
select axe
bindex
>>> f = np.arange(100)
>>> y = np.random.randn(50,100)+1j*np.random.randn(50,100)
>>> F = FUsignal(f,y)
-
plot(**kwargs)[source]¶ plot signal Bsignal
iy : index of the waveform to plot (-1 = all) col : string
default ‘black’
vline : ndarray hline : ndarray unit1 : string
default ‘V’
- unit2string
default ‘V’
xmin : float xmax : float ax : axes instance or [] dB : boolean
default False
- distboolean
default False
- displayboolean
default True
- logxboolean
defaut False
- logyboolean
default False
fig : figure ax : np.array of axes
pylayers.util.plotutil.mulcplot
-
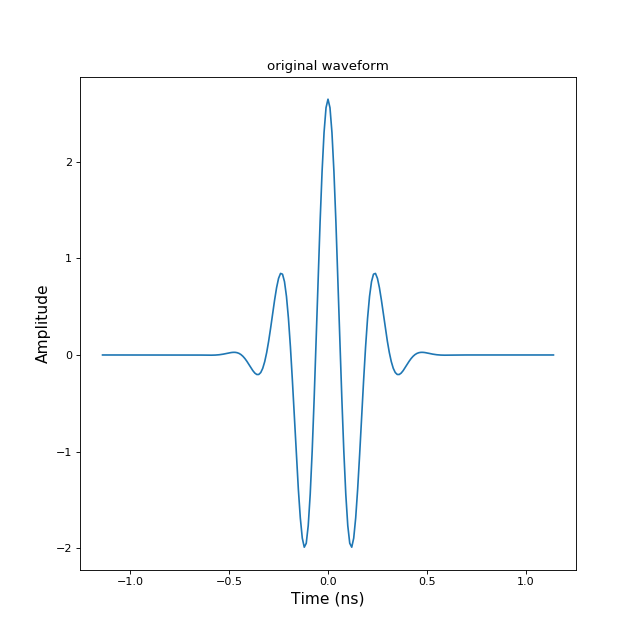
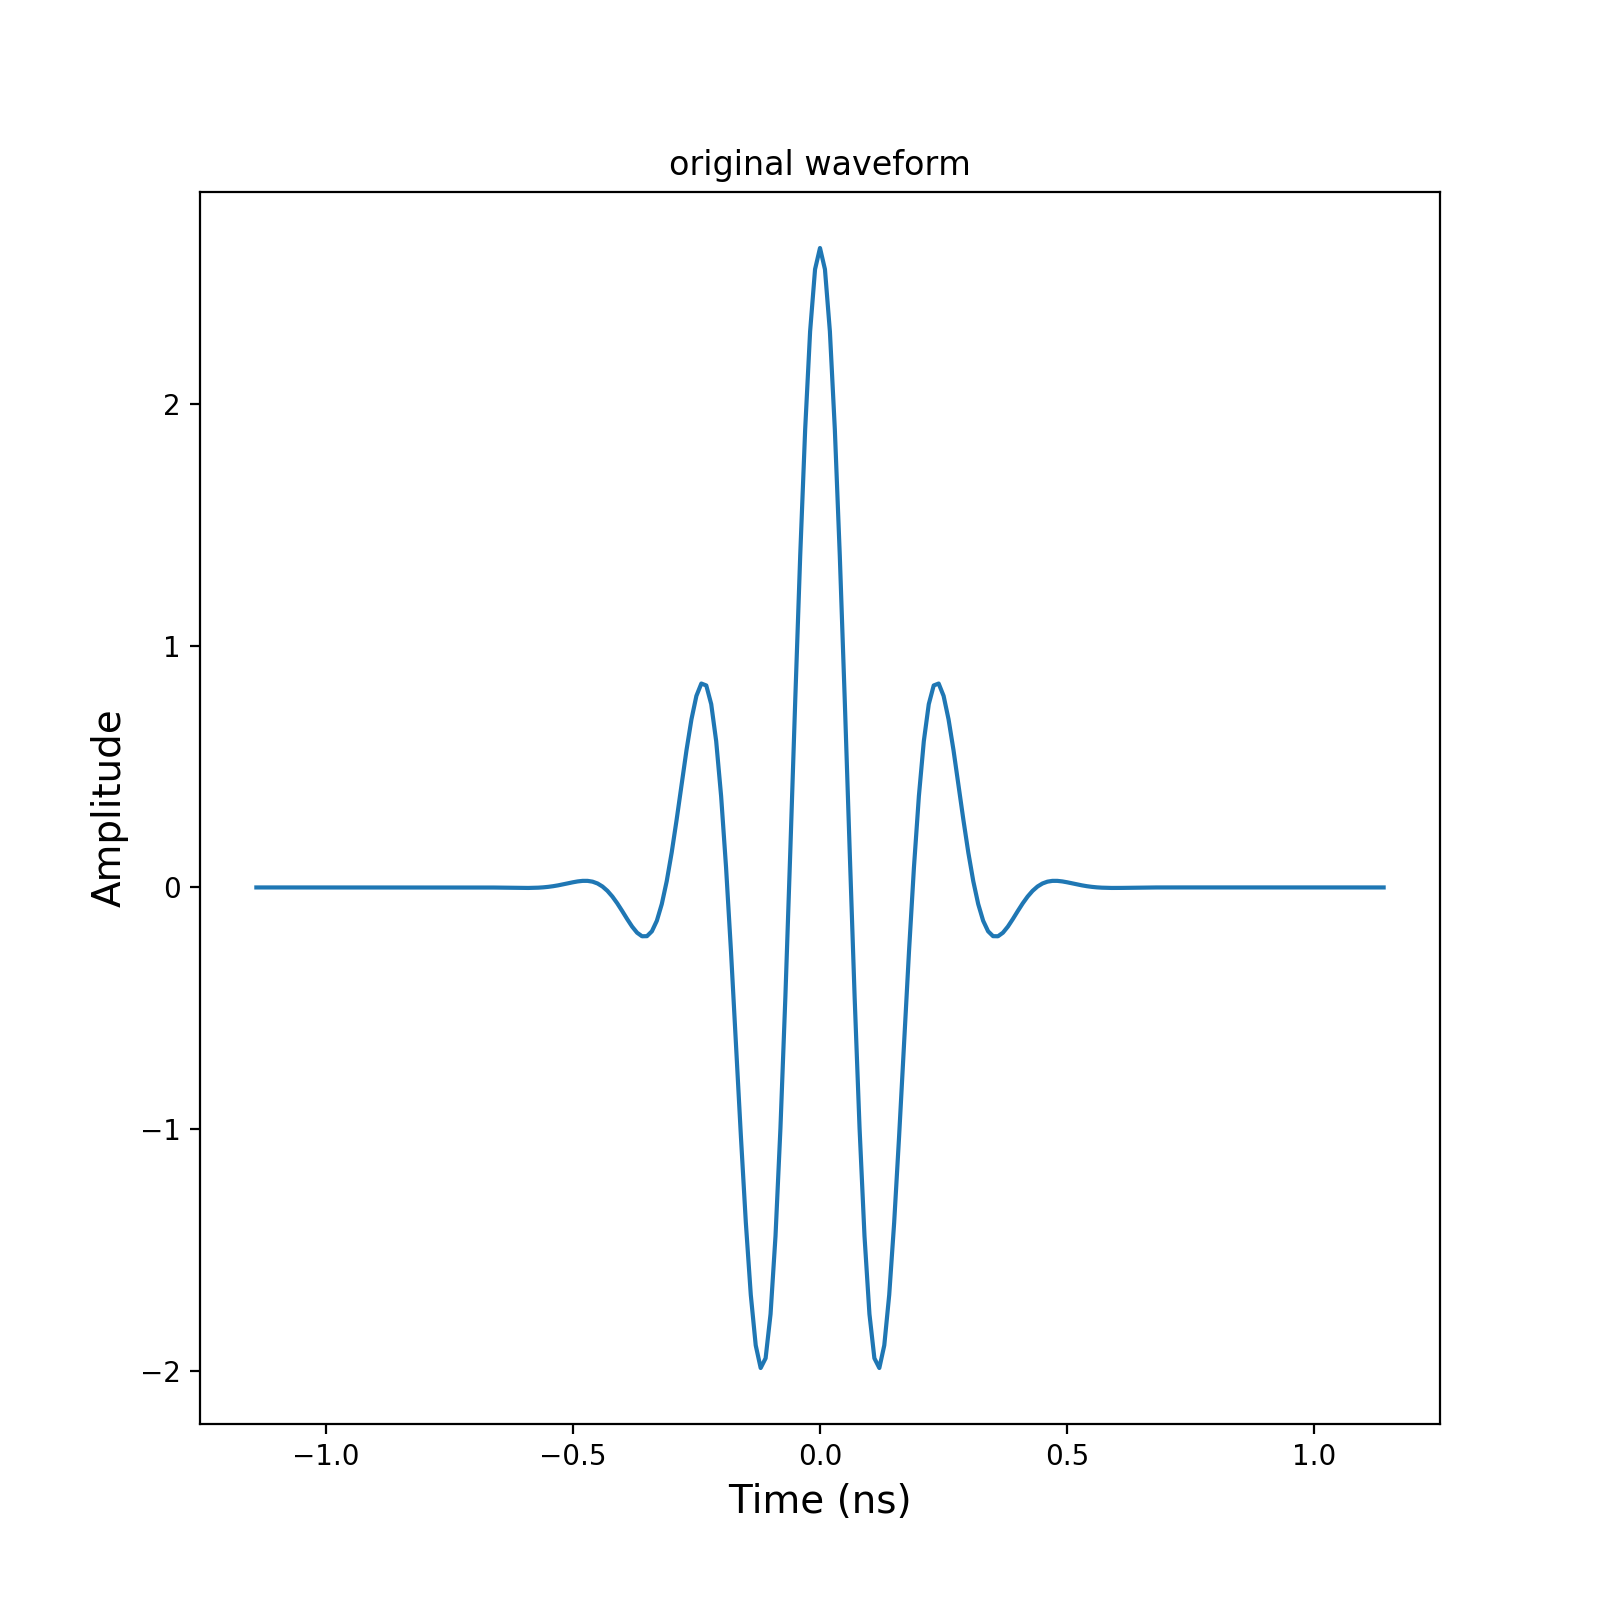
save(filename)[source]¶ save Bsignal in Matlab File Format
filename : string
>>> from pylayers.signal.bsignal import *
>>> import matplotlib.pyplot as plt
>>> e = TUsignal()
>>> e.EnImpulse(feGHz=100)
>>> fig,ax = e.plot(typ=['v'])
>>> tit1 = plt.title('original waveform')
>>> e.save('impulse.mat')
>>> del e
>>> h = TUsignal()
>>> h.load('impulse.mat')
>>> fig,ax = h.plot(typ=['v'])
>>> tit2 = plt.title('retrieved waveform')
Bsignal.load
-

