Layout
-
class
pylayers.gis.layout.Layout(arg='', **kwargs)[source]¶ Bases:
pylayers.util.project.PyLayersHandling Layout
Gs : Graph of points and segment (structure) Gt : Graph of convex cycles (topology) Gv : Graph of visibility (visibility) Gi : Graph of interactions (interactions) Gr : Graph of rooms (rooms) Nnode : Number of nodes of Gs Nedge : Number of edges of Gs pt : points sequence tahe : tail head
This class uses networkx to store Layout information
Gs : structure Gt : topology Gv : visibility Gi : interaction Gr : room Gm : Gw : ways
Np Ns Nss
ax : (xmin,ymin,xmax,ymax) axn : (0,Dx,0,Dy)
filefur filegeom filematini fileslabini hasboundary segboundary min_sx min_sy max_sx max_sy labels lbltg lboundary listtransition loadosm lsss name normal p2pc pg
pt : points coordinates tahe : segment tail head tgs : graph to segment tsg : segment to graph upnt : array of point index
s2pc : segment to point coordinates s2pu : segment to point index sgsg
sl
typ : ‘indoor’ | ‘outdoor’ coordinates : ‘cart’,’lonlat’ version _filename _hash
- _shsegkeys / segment index
values / shapely LineString
- dcakeys / Gt node
values / list of air wall
- degreekeys / point degree
values / array of index
display : dictionnary for controling various visualization dsseg :
indoor : if True allow indoor penetration isbuilt diffraction
maxheight zceil zfloor zmin
Methods Summary
add_fnod([p])add free node p
add_furniture([name, matname, origin, zmin, …])add piece of furniture
add_furniture_file(_filefur[, typ])add pieces of furniture from .ini files
add_nfpe(np0, s1, s2)Add node on s1 from projection of np0 along s2
add_pnod(p, e1, e2)Project point p on segment e1 along segment e2
add_pons(ns[, alpha])add point on segment
add_segment(n1, n2, **kwargs)add segment between node n1 and node n2
angleonlink([p1, p2])angleonlink(self,p1,p2) return (seglist,angle) between p1 and p2
angleonlink3([p1, p2])returns (seglist,angle) in retangular area defined by p1 and p2
angleonlinkold([p1, p2])angleonlink(self,p1,p2) returns seglist between p1 and p2
boundary(**kwargs)add a blank boundary around layout
build([graph, verbose, difftol, multi])build graphs
buildGi([verbose, tqdmpos])build graph of interactions
buildGr()build the graph of rooms Gr
buildGt([check, difftol, verbose, tqdmpos])build graph of convex cycles
Layout.buildGt_oldbuildGv([show, verbose, tqdmpos])build visibility graph
buildGw()build Graph of waypaths
check([level, epsilon])Check Layout consistency
check2()Layout checking
check_Gi()cleanup()cleanup the Layout
clip(xmin, xmax, ymin, ymax)return the list of edges which cross or belong to the clipping zone
closest_edge(p, AAS)not implemented
cy2pt([cy, h])returns a point into a given cycle
cycleinline(c1, c2)returns the intersection between a given line and all segments
del_points(lp)delete points in list lp
del_segment(le[, verbose, g2npy])delete segments in le
diag(p1, p2, l, al1, al2[, quadsel])return edge list from a diagonal zone
dumpr([graphs])read of given graphs
dumpw()pickle dump of specified Graphs
ed2nd(edlist)convert edgelist to nodelist
edit_seg(e1[, data])edit segment
Layout.editorLayout.editorTkexport layout in osm file format
extrseg()calculate extremum of segments
facet3D(e[, subseg])calculate 3D facet from segment
facets3D(edlist[, name, subseg])create facet 3D for geomview
filterGi([situ])filter Gi to manage indoor/outdoor situations
find_edgelist(edgelist, nodelist)edgelist = find_edgelist(edgelist,nodelist)
g2npy([verbose])conversion from graphs to numpy arrays
geomfile([centered])create a .off geomview file
get_Sg_pos(sigarr)return position of the signatures
get_diffslab(npt, lz)get the 2 slabs associated to a diffraction point
get_paths(nd_in, nd_fin)returns the possible paths of graph Gs between two nodes.
get_points(boxorpol[, tol])get points list and segments list in a polygonal zone
get_zone(ax)get point list and segment list in a rectangular zone
getangles(poly[, unit, inside])find angles of a polygon
have_subseg(e1)check if edge e1 have subseg
importosm(**kwargs)import layout from osm file or osmapi
importres(_fileres, **kwargs)import res format
importshp(**kwargs)import layout from shape file
info()gives information about the Layout
info_segment(s1)information about segment
intercy(ncy[, typ])return the list of interactions seen from a cycle
isindoor([pt])test if a point is indoor
ispoint(pt[, tol])check if pt is a point of the Layout
isseg(ta, he)test if ta<->he is a segment
layerongrid(grid, Tx)grid Nx,Ny,2 Tx 1x2 ..
layeronlink(p1, p2)layeronlink(self,p1,p2) return seglist between p1 and p2
load()load a layout from a .lay file
load_modif(_filename[, build, cartesian, dist_m])load a Layout in different formats
loadfur(_filefur)loadfur load a furniture file
ls([typ])list the available file in dirstruc
mask()returns the polygonal mask of the building
merge_segment(n1, n2)merge segment n2 included in n1
nd2seg(ndlist)convert node list to edge list
numseg(ta, he[, first])get segment number from 2 points index
off_overlay([dx, dy])offset overlay image
offset_index([offp, offs])offset points and segment index
onseg(pt[, tol])segment number from point (deprecated)
outputGi([verbose, tqdmpos])filter output of Gi edges
filter output of Gi edges
outputGi_new([verbose, tqdmpos])filter output of Gi edges
plot(**kwargs)plot the layout with shapely MultiLineString
plot_segments(lns, **kwargs)”
pltlines(lines[, fig, ax, color, alpha])plot a line with a specified color and transparency
pltpoly(poly[, fig, ax, color, alpha])plot a polygon with a specified color and transparency
pltvnodes(vn[, fig, ax])plot vnodes
point_touches_seg(pt[, lseg, segtol, tahetol])determine if a point is touching a segment
polysh2geu(poly)transform sh.Polygon into geu.Polygon
pt2cy([pt])point to cycle
pt2ro([pt])point to room
ptGs2cy([n])Gs node to cycle
ptin([pt])check if a point is in the Layout
randTxRx()returns random coordinates for Tx and Rx.
repair(dseg)repair layout
room2nodes(room)returns the nodes of a room
room2segments(room)returns the segments of a room
rotate([angle])rotate the layout
save()save Layout structure in a .lay file
scl_overlay([ax, ay])scale overlay image
seg2pts(aseg)convert segments array from Gs numerotation
seg2ro(seg)return room number of a point
seg_intersection(**kwargs)determine if a segment intersects any other segment of the layout
seginframe(p1, p2)return the seg list of a given zone defined by two points
seginframe2(p1, p2)returns the seglist of a given zone defined by two points (vectorised version)
seginline(p1, p2)returns the intersection between a given line and all segments
segpt([ptlist])return the seg list of a sequence of point number
seguv(iseg)returns unitary vector along segments
show(**kwargs)show layout
show3([bdis, centered])geomview display of the indoor structure
showG([graph])show the different graphs
showGs(**kwargs)show structure graph Gs
showSig(sigarr[, Tx, Rx, fig, ax])Show signature
show_layer(name[, edlist, alpha, width, …])show layer
show_nodes([ndlist, size, color, dlabels, …])show nodes
show_seg1([edlist, alpha, width, size, …])show segment
show_segment(**kwargs)show segment
signature(iTx, iRx)Determine signature between node iTx and node iRx
subseg()establishes the association : name <-> edgelist
thwall(offx, offy)Create a list of wall tuples (Transit.world format )
translate(vec)translate layout
update shapely segment
visi_papb(pa, pb[, edgelist, dtype])visi_papb : determine if pa and pb are in visibility for the structure graph
visilist(p)returns the list of nodes which are visible from point p
waypointGw(nroom1, nroom2)get the waypoint between room1 and room2
wedge(lpnt)calculate wedge angle of a point
wedge2(apnt)calculate wedge angle of a point
Methods Documentation
-
add_fnod(p=(0.0, 0.0))[source]¶ add free node p
p : (1x2) tuple
>>> from pylayers.gis.layout import *
>>> L = Layout('defstr.lay')
>>> L.add_fnod((10.0,10.0))
-13
-
add_furniture(name='R1_C', matname='PARTITION', origin=(0.0, 0.0), zmin=0.0, height=0.0, width=0.0, length=0.0, angle=0.0)[source]¶ add piece of furniture
- namestring
default = ‘R1_C’
- matnamestring
default = ‘PARTITION’
origin : tuple of floats height : float
default = 0
- widthfloat
default = 0
- lengthfloat
default = 0
- anglefloat
default = 0
-
add_furniture_file(_filefur, typ='')[source]¶ add pieces of furniture from .ini files
_filefur : string
-
add_nfpe(np0, s1, s2)[source]¶ Add node on s1 from projection of np0 along s2
np0 : point number s1 : edge number 1 s2 : edge number 2
-
add_pnod(p, e1, e2)[source]¶ Project point p on segment e1 along segment e2
- pndarray
point
- e1int
edge number 1
- e2int
edge number 2
- ..todo
This function is void
-
add_pons(ns, alpha=0.5)[source]¶ add point on segment
- nsint
segment number
- alphaparameterization of the point
alpha = 0 (tail) alpha = 1 (head)
delete segment ns create 2 segments with same properties
-
add_segment(n1, n2, **kwargs)[source]¶ add segment between node n1 and node n2
n1 : integer < 0 n2 : integer < 0 num : segment index (-1 default not given) maxnum : maximum number (-1 default not given) name : string
layer name ‘PARTITION’
- ztuple of 2 floats
default = (0,40000000)
- offsetfloat
[-1,1] default (0)
- bootdoorboolean
if outdoor add an _AIR wall above the segment
num : segment number (>0)
A segment dictionnary has the following mandatory attributes
name : slab name associated with segment z : list (zmin,zmax) (meters) norm : array (1x3) segment normal transition : boolean ncycles : list of involved cycles connect : list of point number iso : list of isosegment
If a segment is _AIR it cannnot be duplicated
-
angleonlink(p1=array([0, 0]), p2=array([10, 3]))[source]¶ angleonlink(self,p1,p2) return (seglist,angle) between p1 and p2
p1 : np.array (2 x Np) or (2,) p2 : np.array (2 x Np) or (2,)
data[‘i’] data[‘s’] : list of segment number data[‘a’] : angle (in radians) between segment and LOS axis
>>> from pylayers.gis.layout import *
>>> L = Layout('DLR.lay')
>>> p1 = np.array([0,0])
>>> p2 = np.array([10,3])
>>> alpha = L.angleonlink(p1,p2)
- #array([(0, 141, 1.2793395519256592), (0, 62, 0.29145678877830505),
(0, 65, 0.29145678877830505)],
dtype=[(‘i’, ‘<i8’), (‘s’, ‘<i8’), (‘a’, ‘<f4’)])
-
angleonlink3(p1=array([0, 0, 1]), p2=array([10, 3, 1]))[source]¶ returns (seglist,angle) in retangular area defined by p1 and p2
p1 : np.array (3 x N) or (3,) p2 : np.array (3 x N) or (3,)
- datastructured array x N
‘i’ : index ‘s’ : slab ‘a’ : angle (in radians)
>>> from pylayers.gis.layout import *
>>> L = Layout('DLR2.lay')
>>> p1 = np.array([0,0,1])
>>> p2 = np.array([10,3,2])
>>> data = L.angleonlink3(p1,p2)
- #array([(0, 141, 1.2793395519256592), (0, 62, 0.29145678877830505),
(0, 65, 0.29145678877830505)],
dtype=[(‘i’, ‘<i8’), (‘s’, ‘<i8’), (‘a’, ‘<f4’)])
antprop.loss.Losst geomutil.intersect3
-
angleonlinkold(p1=array([0, 0]), p2=array([10, 3]))[source]¶ angleonlink(self,p1,p2) returns seglist between p1 and p2
- p1(1 x 2 )
[0,0]
- p2(1 x 2 )
[10,3]
- seglistlist
list of segment number on the link
theta
#>>> from pylayers.gis.layout import * #>>> L = Layout(‘DLR.lay’,’matDB.ini’,’slabDB.ini’) #>>> p1 = np.array([0,0]) #>>> p2 = np.array([10,3]) #>>> L.angleonlinkold(p1,p2) #(array([59, 62, 65]), array([ 1.27933953, 0.29145679, 0.29145679]))
-
boundary(**kwargs)[source]¶ add a blank boundary around layout
- percxfloat
percentage of Dx for x offset calculation (default 0.15)
- percyfloat
percentage of Dy for y offset calculation (default 0.15)
xlim : tuple minD : minimum distance for boundary force : boolean
force modification of boundaries even if one boundary already exists
- minDint
minimal distance over x and y
self.lboundary is the list of the nodes of the added boundary self.axn is the zone without the boundary extension self.ax is updated
>>> from pylayers.gis.layout import *
>>> L = Layout('defstr.lay')
>>> L.boundary()
This function calls g2npy
-
build(graph='tvirw', verbose=False, difftol=0.15, multi=False)[source]¶ build graphs
- graphstring composed of
‘t’ : Gt ‘v’ : Gv ‘i’ : Gi ‘r’ : Gr ‘w” : Gw
verbose : boolean difftol : diffraction tolerance multi : boolean
enable multi processing
This function builds all the graph associated with the Layout.
Warning : by default the layout is saved (dumpw) after each build
-
buildGi(verbose=False, tqdmpos=0)[source]¶ build graph of interactions
For each node of graph Gv creates 5 different nodes associated to the same segment
(np,) D (ns,cy0) R -> cy0 (ns,cy1) R -> cy1 (ns,cy0,cy1) T 0->1 (ns,cy1,cy0) T 1->0
Gi is an oriented Graph (DiGraph)
-
buildGr()[source]¶ build the graph of rooms Gr
adjascent rooms are connected
Gr is at startup a deep copy of Gt
The difficulty here is to take into account the AIR transition segments
-
buildGt(check=True, difftol=0.01, verbose=False, tqdmpos=0)[source]¶ build graph of convex cycles
check : boolean difftol : float verbose : boolean tqdmpos : progressbar
todo : - add an option to only take outside polygon
=> pass to self._triangle a hole coreesponding to centroid of polygon except those of boundary ( see buildGtold )
-
buildGv(show=False, verbose=False, tqdmpos=0)[source]¶ build visibility graph
- showboolean
default False
verbose : boolean tqdmpos : progressbar
>>> from pylayers.gis.layout import *
>>> L = Layout('TA-Office.lay')
>>> L.buildGt()
>>> Ga = L.buildGr()
>>> L.buildGv()
This method exploits cycles convexity.
-
buildGw()[source]¶ build Graph of waypaths
buildGr
- for all edges of Gr (adjascent room)
if room1 and room2 have a common transition
-
check(level=0, epsilon=0.64)[source]¶ Check Layout consistency
level : int
- consistentBoolean
True if consistent
dseg : dictionnary of segments
GeomUtil.isBetween
- For all segments
- get the 2 vertices
- for all the other vertices
check if it belongs to segment
If there are points which are not valid they are displayed
In red point with degree == 1 , In black points with degree == 0
-
cleanup()[source]¶ cleanup the Layout
Remove nodes which are not connected
Remove supperimposed segments
-
clip(xmin, xmax, ymin, ymax)[source]¶ return the list of edges which cross or belong to the clipping zone
xmin : float xmax : float ymin : float ymax : float
seglist : list of segment number
Determine all segments outside the clipping zone
Union of the 4 conditions
setdiff1d between the whole array of segments and the segments outside
-
closest_edge(p, AAS)[source]¶ not implemented
This function return the closest segment from p which belong to the AAS (Allowed Angular Sector)
[ns] = closest_edge(self,p,AAS)
-
cy2pt(cy=0, h=1.2)[source]¶ returns a point into a given cycle
- cyint
cycle number
- hfloat
point height
- pointnd.array
3d point
Layout.pt2cy
-
cycleinline(c1, c2)[source]¶ returns the intersection between a given line and all segments
- c1int
point
- c2int
point
I : numpy.ndarray
pylayers.antprop.signature.Signatures.rays pylayers.gis.layout.Layout.seginframe2
This function is used to detect LOS conditions
-
del_segment(le, verbose=True, g2npy=True)[source]¶ delete segments in le
le : list of segments number
pylayers.gis.layout.Layout.del_node
100% of time is in g2npy
-
diag(p1, p2, l, al1, al2, quadsel=0)[source]¶ return edge list from a diagonal zone
p1 : np.array p2 : np.array tol : al1 : al2 : quadsel : 0 all quadrant
2 1 3 4
edgelist
-
dumpr(graphs='stvirw')[source]¶ read of given graphs
- graphstring
‘s’ : Gv ‘t’ : Gt ‘r’ : Gr ‘v’ : Gv ‘i’ : Gi
.gpickle files are store under the struc directory of the project specified by the $BASENAME environment variable
-
dumpw()[source]¶ pickle dump of specified Graphs
graphs which are in lbltg are saved in pickle format
‘t’ : Gt ‘s’ : Gs ‘v’ : Gv ‘i’ : Gi ‘r’ : Gr
-
ed2nd(edlist)[source]¶ convert edgelist to nodelist
- edlistlist or ndarray
edge list
- ndlistndarray
node list
-
edit_seg(e1, data={})[source]¶ edit segment
- e1integer
edge number
- datadict
dictionnary of value of seg or subseg
- A segment has the following properties :
name : string
z : tuple
transition : boolean (default FALSE)
offset : [-1,1]
If a segment has subsegments attached the following properties are added :
ss_name : list of string
ss_z : list of subsegment e.q. [(min height (meters),max height (meters))]
ss_offset : list of offset in [0,1]
-
exportosm()[source]¶ export layout in osm file format
_filename : string
layout.loadosm layout.loadini layout.check
-
extrseg()[source]¶ calculate extremum of segments
- update the following members
min_sx max_sx min_sy max_sy
Used in seginframe
-
facet3D(e, subseg=False)[source]¶ calculate 3D facet from segment
- sint
segment number
- subsegboolean
default False
-
facets3D(edlist, name='Layer', subseg=False)[source]¶ create facet 3D for geomview
edlist name : string subseg : boolean
-
find_edgelist(edgelist, nodelist)[source]¶ edgelist = find_edgelist(edgelist,nodelist)
edgelist : input edgelist nodelist : input nodelist
return the subset of edgelist
Not Finished :
-
g2npy(verbose=False)[source]¶ conversion from graphs to numpy arrays
verbose : boolean
This function updates the following arrays in self:
pt (2xNp)
pg center of gravity
tahe (2xNs)
tgs : graph to segment
tsg : segment to graph
dca : dictionnary of cycle with an airwall (_AIR)
s2pu : sparse_lil_matrix
s2pc : sparse_lil_matrix
lsss : list of iso segments
maxheight :
normal :
assert self.pt[self.iupnt[-1]] == self.pt[:,self.iupnt[-1]]
extrseg
-
geomfile(centered=False)[source]¶ create a .off geomview file
- centeredBoolean
if True the layout is centered around its center of gravity
The .off file can be vizualized through the show3 method
>>> from pylayers.gis.layout import *
>>> L = Layout('DLR.lay')
>>> pg = L.geomfile()
-
get_diffslab(npt, lz)[source]¶ get the 2 slabs associated to a diffraction point
lnpt : diffraction point numbers (node of Gs) lz : array of candidate heights of the diffraction point
As a diffraction point may involve iso segments the nature of the diffraction interaction depends on a height parameter This function extacts the couple of slab from this information
a list of 2-segments . the length of this list == length of lz
a list of slab tuples. the length of this list == length of lz
[[443, 529], [444, 530]] [[‘WALL’, ‘WALL’], [‘AIR’, ‘AIR’]]
-
get_paths(nd_in, nd_fin)[source]¶ returns the possible paths of graph Gs between two nodes.
- nd_in: int
initial graph node (segment or point)
- nd_fin: int
final graph node (segment or point)
- pathslist
paths between nd_in and nd_fin
-
get_points(boxorpol, tol=0.05)[source]¶ get points list and segments list in a polygonal zone
- boxorpollist or tuple
- [xmin,xmax,ymin,ymax]
or shapely Polygon
- (pt,ke)points coordinates and index
pt : (2xn) ke : (,n)
This method returns all the existing Layout points inside a box zone or the boundary of a polygon
-
get_zone(ax)[source]¶ get point list and segment list in a rectangular zone
- axlist ot tuple
[xmin,xmax,ymin,ymax]
ptlist,seglist
-
getangles(poly, unit='rad', inside=True)[source]¶ find angles of a polygon
poly : geu.Polygon or sh.Polygon unit : str
‘deg’ : degree values ‘rad’ : radian values
- insideboolean
- Truecompute the inside angles of the cycle.
(a.k.a. the interior of the polygon)
- Falsecompute the outside angles of the cycle.
(a.k.a. the exterior of the polygon)
(u,a) u : int (Np)
point number
- afloat (Np)
associated angle to the point
http://www.mathopenref.com/polygonexteriorangles.html
TODO : This function should be moved in geomutil.py (NOT USED)
-
importosm(**kwargs)[source]¶ import layout from osm file or osmapi
fileosm : string address : string
address to be geocoded
- latlontuple
(latitude,longitude) degrees
- dist_mfloat
distance in meter from the geocoded address (def 200 m )
- cartboolean
conversion in cartesian coordinates
The best and recommended manner to edit a layout is to use the josm editor in association with the piclayer plugin. This plugin allows to place a geo-adjusted image in the background which is very convenient for editing floorplan of buildings.
In josm editor, nodes are numbered with negative indexes, while in pylayers they have a positive index.
pylayers.gis.osmparser.osmparse
-
importres(_fileres, **kwargs)[source]¶ import res format
col1 : x1 coordinates col2 : y1 coordinates col3 : x2 coordinates col4 : y2 coordinates col5 : building height col6 : building number col7 : building class col8 : ground height
COST231 data Munich_buildings.res
-
intercy(ncy, typ='source')[source]¶ return the list of interactions seen from a cycle
ncy : cycle number( Project -> save project) typ : string
if ‘source’ connect source cycle if ‘target’ connect target cycle
This method is called at the beginning of signature evaluation in order to get the starting and ending interaction. It exploits the information contained in teh graph Gi.
-
isindoor(pt=array([0, 0]))[source]¶ test if a point is indoor
- ptnp.array 1x2
2d point
- b1boolean
True if indoor
-
ispoint(pt, tol=0.05)[source]¶ check if pt is a point of the Layout
pt : point (2,1) tol : float
default (0.05 meters)
if True the point number (<0) is returned else 0 is return
pt : point number if point exists 0 otherwise
pylayers.util.geomutil.Polygon.setvnodes
-
layeronlink(p1, p2)[source]¶ layeronlink(self,p1,p2) return seglist between p1 and p2
p1 : (1 x 2 ) p2 : (1 x 2 )
-
load()[source]¶ load a layout from a .lay file
The filename is in self._filename
[info] format = {cart | latlon} version = type = {indoor | outdoor}
[points] -1 = (x,y)
[segments] 1 = {‘slab’:’‘,transition:boolean,’connect:[-1,-2],’z’:(0,3)}
[slabs] WALL = {‘lthick’:[,],’lmat’:[,],’color:’‘,’linewidth’:float}
[materials] BRICK = {‘mur’:complex,’epsr’:complex,’sigma’:float,’roughness’:}
[polygons] 1 = {‘connect’:[1,2,3,4],’name’:NAME,’z’:(zmin,zmax)}
[indoor] zceil = zfloor =
[latlon] llcrnrlon = llcrnrlat = urcrnrlon = urcrnrlat = projection =
-
load_modif(_filename, build=True, cartesian=False, dist_m=400)[source]¶ load a Layout in different formats
_filename : string
.lay : ini file format (natural one) DIRLAY
-
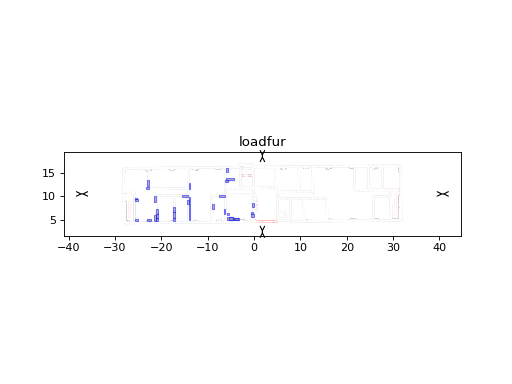
loadfur(_filefur)[source]¶ loadfur load a furniture file
- _filefurstring
short name of the furniture ini file
Furniture objects are stored in self.lfur list
Load a Layout file and an associated furniture ini file
>>> import matplotlib.pyplot as plt
>>> from pylayers.gis.layout import *
>>> L = Layout('WHERE1.lay')
>>> L.loadfur('Furw1.ini')
>>> fig = plt.figure()
>>> ax = fig.gca()
>>> fig,ax = L.showGs(fig=fig,ax=ax,furniture=True)
>>> ti = plt.title('loadfur')
>>> plt.show()
-
ls(typ='lay')[source]¶ list the available file in dirstruc
- typstring optional
{‘lay’|’osm’|’wrl’}
- lfile_slist
sorted list of all the .str file of strdir
strdir is defined in the Project module
Display all available structures
>>> from pylayers.gis.layout import *
>>> L = Layout()
>>> fillist = L.ls()
-
mask()[source]¶ returns the polygonal mask of the building
mask : geu.Polygon
This function assumes graph Gt has been generated
-
merge_segment(n1, n2)[source]¶ merge segment n2 included in n1
- n1int
segment 1 (the larger) index
- n2int
segment 2 (the smaller) index
-
nd2seg(ndlist)[source]¶ convert node list to edge list
- ndlistlist or ndarray
node list
- seglistndarray
edge list
previously nd2ed
-
numseg(ta, he, first=True)[source]¶ get segment number from 2 points index
ta : int <0 he : int <0 first : Boolean
if True returns only one among the several iso segments else returns a np.array of iso segments
nseg : > 0 if 0 not a segment
-
offset_index(offp=0, offs=0)[source]¶ offset points and segment index
offp : offset points offs : offset segments
Portage vers networkx 2. inacheve
__add__
-
onseg(pt, tol=0.01)[source]¶ segment number from point (deprecated)
return segment number which contains point pt
pt np.array(1x2) tol = 0.01 tolerance
-
outputGi(verbose=False, tqdmpos=0.0)[source]¶ filter output of Gi edges
L : Layout
Let assume a sequence (nstr0,nstr1,{nstr2A,nstr2B,…}) in a signature. This function checks whether this sequence is feasible or not , whatever the type of nstr0 and nstr1. The feasible outputs from nstr0 to nstr1 are stored in an output field of edge (nstr0,nstr1)
pylayers.util.cone.Cone.from2seg pylayers.util.cone.Cone.belong_seg
-
outputGi_mp()[source]¶ filter output of Gi edges
L : Layout
Let assume a sequence (nstr0,nstr1,{nstr2A,nstr2B,…}) in a signature. This function checks whether this sequence is feasible or not , whatever the type of nstr0 and nstr1. The feasible outputs from nstr0 to nstr1 are stored in an output field of edge (nstr0,nstr1)
pylayers.util.cone.Cone.from2seg pylayers.util.cone.Cone.belong_seg
-
outputGi_new(verbose=False, tqdmpos=0.0)[source]¶ filter output of Gi edges
this version of outputGi, uses sparses matrix instead of NetworkX for MP purpose
L : Layout
Let assume a sequence (nstr0,nstr1,{nstr2A,nstr2B,…}) in a signature. This function checks whether this sequence is feasible or not , whatever the type of nstr0 and nstr1. The feasible outputs from nstr0 to nstr1 are stored in an output field of edge (nstr0,nstr1)
pylayers.util.cone.Cone.from2seg pylayers.util.cone.Cone.belong_seg
-
plot(**kwargs)[source]¶ plot the layout with shapely MultiLineString
show : boolean fig :figure ax : labels : list nodes : boolean
fig, ax
>>> L= Layout('Munich.lay',bbuild=False)
>>> L.plot(show=True)
-
pltlines(lines, fig=[], ax=[], color='r', alpha=1)[source]¶ plot a line with a specified color and transparency
lines : shapely lines fig : matplotlib figure ax : figure axis color : string alpha : float
transparency
pylayers.gis.layout.Layout.plot
-
pltpoly(poly, fig=[], ax=[], color='r', alpha=0.2)[source]¶ plot a polygon with a specified color and transparency
TODO : To be deplaced in an ither class
-
point_touches_seg(pt, lseg=[], segtol=0.01, tahetol=0.01)[source]¶ determine if a point is touching a segment
pt : a point (2,) seg : a list of segments to test.
if [] => all Gs segments are tested
segdtol : distance tolerance point to segment tahetol : distance tolerance point to segment extremeties
- => a point on segment extremeties is considered
not touching the segseg
ltseg : lsit of touched segments (by the point)
-
pt2cy(pt=array([0, 0]))[source]¶ point to cycle
pt : point (ndarray)
ncy : cycle number
If a cycle contains point pt this function returns the cycle number
Layout.cy2pt
-
pt2ro(pt=array([0, 0]))[source]¶ point to room
pt : point (ndarray)
nr : Room number
If a room contains point pt this function returns the room number
-
ptGs2cy(n=-1)[source]¶ Gs node to cycle
upt : point (ndarray)
ncy : cycle number
If a cycle contains the Gs pointt this function returns the cycle(s) number
-
ptin(pt=array([0, 0, 0]))[source]¶ check if a point is in the Layout
pt : point (ndarray)
boolean : True if inside
ispoint
-
randTxRx()[source]¶ returns random coordinates for Tx and Rx.
- p_Txnumpy.ndarray
A point of the placement of the Tx
- p_Rxnumpy.ndarray
A point of the placement of the Rx
>>> from pylayers.gis.layout import *
>>> L = Layout('defstr.lay')
>>> p_Tx,p_Rx = L.randTxRx()
ex fn Tx_Rx_pos
-
repair(dseg)[source]¶ repair layout
- dsegdict
{ns : [np1,np2]}
Merge the superposed segments which has been determined by the check method.
-
seg2pts(aseg)[source]¶ convert segments array from Gs numerotation
to corresponding termination points array in pt
- asegnp.array (,Ns) or int for single value:w
array of segment number (>0)
- pthnp.array (4 x Ns)
pth is a vstacking of tail point (2,Ns) and head point (2,Ns)
>>> from pylayers.gis.layout import *
>>> import numpy as np
>>> L = Layout('defstr.lay')
>>> aseg = np.array([1,3,6])
>>> pt =  L.seg2pts(aseg)
surprisingly self.s2pc is slower than this function
-
seg2ro(seg)[source]¶ return room number of a point
seg : int
nr : Room number
If a room contains point pt this function returns the room number
-
seg_intersection(**kwargs)[source]¶ determine if a segment intersects any other segment of the layout
shLine : a shapely LineString or ta,he : tail/head of a segment
llay_seg : list of layout’s segments intersected lshP : list of shapely points of intersections.
editor.py
-
seginframe(p1, p2)[source]¶ return the seg list of a given zone defined by two points
- p1
array (1 x 2)
- p2
array (1 x 2)
- seglist
list of segment number inside a planar region defined by p1 an p2
>>> from pylayers.gis.layout import *
>>> L = Layout('TA-Office.lay')
>>> p1 = np.array([0,0])
>>> p2 = np.array([10,10])
>>> L.seginframe(p1,p2)
array([ 1,  3,  7,  8, 14, 15, 16, 17, 18, 20, 21, 23, 24, 26, 27, 29, 30,
       32, 33, 34, 35, 36, 37, 38, 39, 40, 41, 42, 44, 46, 47, 52, 53, 54,
       55, 56, 57, 58, 59, 60, 61, 62, 63, 64, 65, 66, 67, 68, 69, 70, 71,
       72, 73, 74, 75, 76, 77, 78, 81, 82, 85, 86])
-
seginframe2(p1, p2)[source]¶ returns the seglist of a given zone defined by two points (vectorised version)
- p1 array (2 x N)
array of N 2D points
- p2 array (2 x N)
array of N 2D points
- seglist
list of segment number inside a planar region defined by p1 an p2 separated by -1
>>> from pylayers.gis.layout import *
>>> L = Layout('TA-Office.lay')
>>> p1 = np.array([[0,0,0],[0,0,0]])
>>> p2 = np.array([[10,10,10],[10,10,10]])
>>> seglist = L.seginframe2(p1,p2)
>>> edlist  = [ L.tsg[x] for x in  seglist ]
>>> fig,ax = L.showG('s',edlist=edlist)
-
seginline(p1, p2)[source]¶ returns the intersection between a given line and all segments
p1 : numpy.ndarray p2 : numpy.ndarray
I : numpy.ndarray
-
segpt(ptlist=array([0]))[source]¶ return the seg list of a sequence of point number
- ptlist array(1xNp)
point number array
- seglist
array seglist associated with ptlist
>>> from pylayers.gis.layout import *
>>> L = Layout('TA-Office.lay')
>>> ptlist  = np.array([0,1])
>>> seg = L.segpt(ptlist)
-
seguv(iseg)[source]¶ returns unitary vector along segments
- isegnp.array
index of segments
>>> from pylayers.gis.layout import *
>>> L = Layout('DLR.lay')
>>> idx = np.array([1,2,3,17])
>>> v1 = L.seguv(idx)
>>> idx = np.array([1])
>>> v2= L.seguv(idx)
-
show3(bdis=True, centered=True)[source]¶ geomview display of the indoor structure
- bdis boolean (default True)
boolean display (call geowview if True)
- centeredboolean
if True center the layout before display
-
showG(graph='s', **kwargs)[source]¶ show the different graphs
- graphchar
‘t’ : Gt ‘r’ : Gr ‘s’ : Gs ‘v’ : Gv ‘i’ : Gi
- figmatplotlib figure
[]
- axmatplotlib figure
[]
- showboolean
False
- nodesboolean
alse
- edgesboolean
True
- airwalls | aw: boolean
display airwalls (False)
- subseg: boolean
display subsegments (False)
- slabboolean
display color and width of slabs (False)
- labelsboolean |list
display graph labels (False) if list precise label of which cycle to display (e.g. [‘t’])
- alphanfloat
transparency of nodes (1.0)
- alphaefloat
transparency of edges (1.0)
- widthfloat
line width (2)
- node_color: string
w
- posnode_color: string
positive node color (k)
- negnode_color: string
negative node color (b)
- edge_colorstring
k
- node_sizefloat
20
- font_sizefloat
15,
- nodelistlist
list of nodes to be displayed (all)
- edgelistlist
list of edges to be displayed (all)
- modestring
‘cycle’ | ‘none’ | ‘room’
- alphacystring
transparency of cycles (0.8)
- colorcy :
‘#abcdef’
- linterlist
list of interaction for Gi [‘RR’,’TT’,’RT’,’TR’,’RD’,’DR’,’TD’,’DT’,’DD’]
- show0boolean
If true display connection to cycle 0 of Gt (False)
- ededboolean
True
- ndndboolean
True
- ndedboolean
True
- widthint
2
- nodelistlist
[]
overlay : boolean
- diffraction :boolean
False
- defaults = {‘show’: False,
‘fig’: [], ‘ax’: [], ‘nodes’: False, ‘edges’: True, ‘sllist’:[], ‘airwalls’: False, ‘subseg’: False, ‘slab’: True, ‘labels’: False, ‘alphan’: 1.0, ‘alphae’: 1.0, ‘width’: 2, ‘node_color’:’w’, ‘edge_color’:’k’, ‘node_size’:20, ‘font_size’:15, ‘nodelist’: [], ‘edgelist’: [], ‘figsize’: (5,5), ‘mode’:’nocycle’, ‘alphacy’:0.8, ‘colorcy’:’abcdef’, ‘linter’ : [‘RR’,’TT’,’RT’,’TR’,’RD’,’DR’,’TD’,’DT’,’DD’], ‘show0’:False, ‘axis’:False, ‘overlay’:False, ‘diffraction’:False }
>>> from pylayers.gis.layout import  *
>>> import matplotlib.pyplot as plt
>>> L = Layout('TA-Office.lay')
>>> L.dumpr()
>>> fig = plt.figure(figsize=(10,10))
>>> ax = fig.add_subplot(221)
>>> fig,ax = L.showG('s',fig=fig,ax=ax)
>>> tis = plt.title("Gs")
>>> ax = fig.add_subplot(222)
>>> fig,ax = L.showG('t',fig=fig,ax=ax)
>>> tit = plt.title("Gt")
>>> ax = fig.add_subplot(223)
>>> fig,ax = L.showG('r',fig=fig,ax=ax)
>>> tic = plt.title("Gr")
>>> ax = fig.add_subplot(224)
>>> fig,ax = L.showG('v',fig=fig,ax=ax)
>>> tiv = plt.title("Gv")
>>> plt.show()
pylayers.util.graphutil.draw
-
showGs(**kwargs)[source]¶ show structure graph Gs
- ndlistnp.array
set of nodes to be displayed
- edlistnp.array
set of edges to be displayed
- roomlistlist
default : []
axis : width : int
2
fGHz : float show : boolean
default True
- furnitureboolean
default False
display parameters are defined in display dictionnary
ax
pylayers.gis.layout.showG
-
showSig(sigarr, Tx=None, Rx=None, fig=[], ax=None)[source]¶ Show signature
- Txnp.array (2,1)
Transmitter coordinates
- Rxnp.array (2,1)
Receipter coordinates
- srboolean
show room signature
fig : figure instance ax : axes instance lines : lines instance
-
show_layer(name, edlist=[], alpha=1, width=0, color='black', dnodes=False, dthin=False, dlabels=False, font_size=15, fGHz=[], fig=[], ax=[])[source]¶ show layer
name : edlist : [] alpha : float
transparency
- widthint
if width = 0 width depends on slab property
- colorstring
default black’
- dnodes :
display nodes (False )
- dthin :
display thin ( False )
- dlabels :
display labels ( False )
font_size
show_segment
-
show_nodes(ndlist=[100000000.0], size=10, color='b', dlabels=False, font_size=15, alpha=1, node_shape='o', fig=[], ax=[])[source]¶ show nodes
ndlist size : int
default 10
color : ‘b’ dlabels : Boolean
False
- font_sizeint
15
- alphafloat
transparancy
show_segment showGs
-
show_seg1(edlist=[], alpha=1, width=1, size=2, color='black', font_size=15, dlabels=False)[source]¶ show segment
edlist alpha width size color font_size dlabels
-
show_segment(**kwargs)[source]¶ show segment
- edlistlist
segment list
- alphafloat
transparency 0< alpha < 1
- widthfloat
line width (default 1)
- colorstring
default ‘black’
- dnodesboolean
display nodes ( Default False)
- dlabelsboolean
display labels ( Default False)
- font_sizeint
Default 15
show_nodes
-
signature(iTx, iRx)[source]¶ Determine signature between node iTx and node iRx
- cy1int
source cycle
- cy2int
target cycle
sigarr : signature :
- This a temporary function
There is some algorithmic work to find the best way to determine signature T4 : limit the ndt to only edges and nodes in visibility from Tx
-
subseg()[source]¶ establishes the association : name <-> edgelist
- dicodict
sub segment name as key and segment number as value
-
thwall(offx, offy)[source]¶ Create a list of wall tuples (Transit.world format )
offx offy
walls : list of wall tuples (Transit format)
>>> from pylayers.gis.layout import *
>>> L = Layout('DLR.lay')
>>> walls = L.thwall(0,0)
-
updateshseg()[source]¶ update shapely segment
build a shapely object for all segments
This function is called at the beginning of buildGt.
buildGt
-
visi_papb(pa, pb, edgelist=array([], dtype=float64))[source]¶ visi_papb : determine if pa and pb are in visibility for the structure graph
visi_papb(pa,pb,edgelist)
pa : 1x2 pb : 1x2 edgelist : exclusion edge list
-
visilist(p)[source]¶ returns the list of nodes which are visible from point p
- p
np.array point
AAS = [0:2pi] While (AAS != void set)
Find segment ns either i) the closest segment from p in AAS ii) neighbor of prec(ns)
Find the edgelist visible from ns
- edgelist = vedgelist(ns)
Check_occultation(p,ns,edgelist) Occultation 8 situations [p1,pM,p2] = [T,T,T] : fully occulted
[ ] partially visible [F,F,F] : fully visible
Update Allowed Angular Sector (AAS)