Coverage
-
class
pylayers.antprop.coverage.Coverage(_fileini='coverage.ini')[source]¶ Bases:
pylayers.util.project.PyLayersHandle Layout Coverage
- creategrid()
create a uniform grid for evaluating losses
- cover()
run the coverage calculation
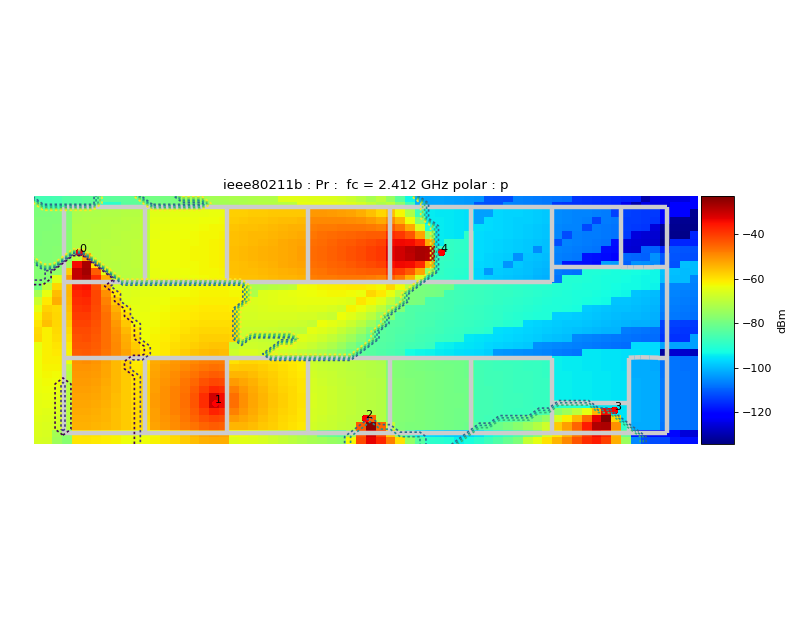
- showPower()
display the map of received power
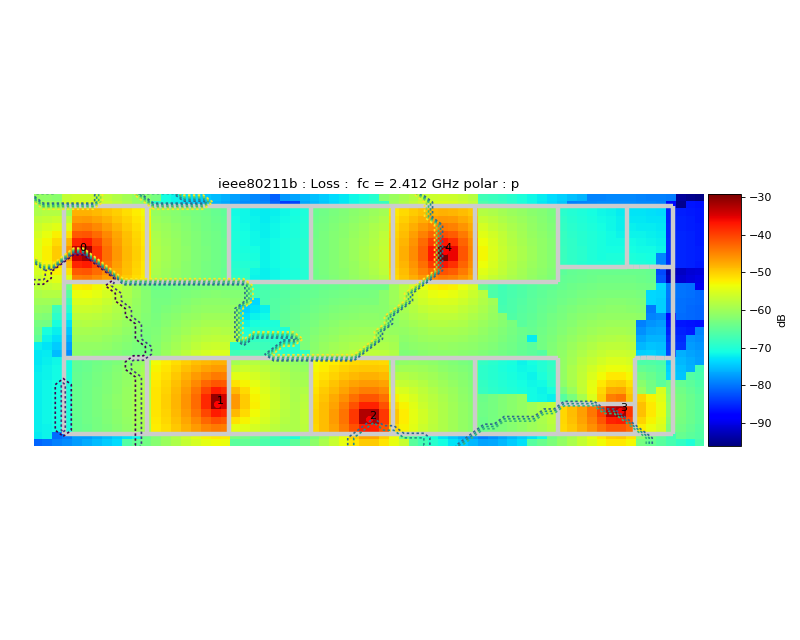
- showLoss()
display the map of losses
All attributes are read from fileini ino the ini directory of the current project
- _fileini
default coverage.ini
L : a Layout nx : number of point on x ny : number of point on y tx : transmitter position txpe : transmitter power emmission level show : boolean for automatic display power map na : number of access point
Methods Summary
cover(**kwargs)run the coverage calculation
creategrid([mode, boundary, _fileini])create a grid
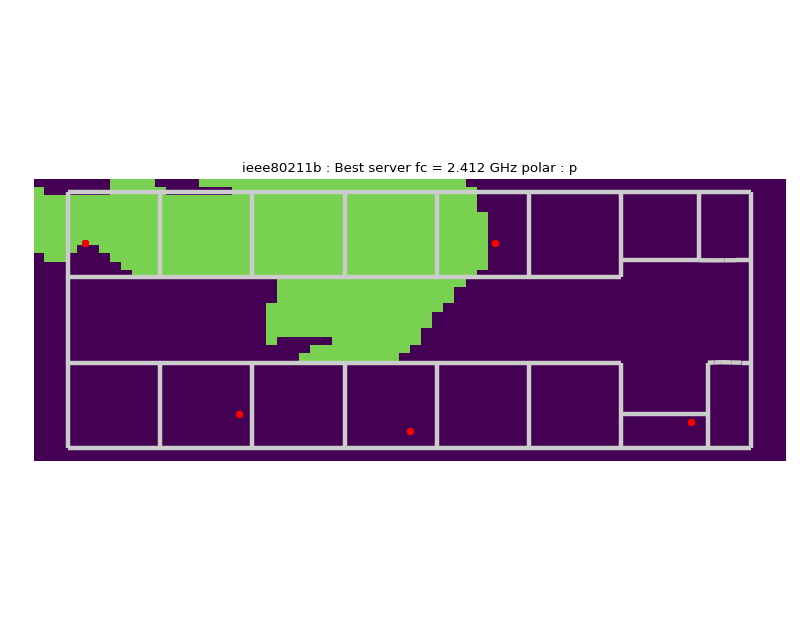
evbestsv()determine the best server map
evsinr()calculates sinr
evsnr()calculates signal to noise ratio
plot(**kwargs)show(**kwargs)show coverage
where1()Unfinished : Not sure this is the right place (too specific)
Methods Documentation
-
cover(**kwargs)[source]¶ run the coverage calculation
sinr : boolean snr : boolean best : boolean size : integer
size of grid points block
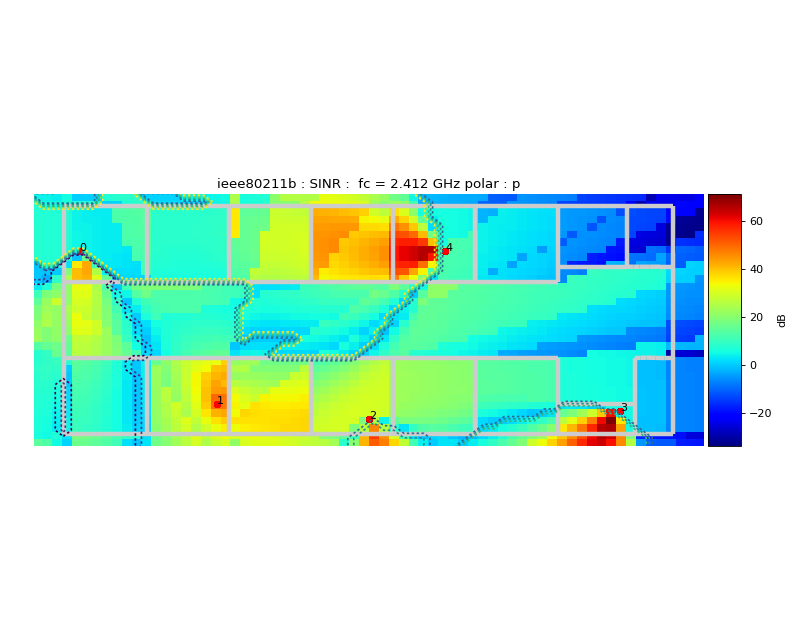
>>> from pylayers.antprop.coverage import *
>>> C = Coverage()
>>> C.cover()
>>> f,a = C.show(typ='sinr',figsize=(10,8))
>>> plt.show()
self.fGHz is an array, it means that Coverage is calculated at once for a whole set of frequencies. In practice, it would be the center frequency of a given standard channel.
This function is calling loss.Losst which calculates Losses along a straight path.
In a future implementation we will abstract the EM solver in order to make use of other calculation approaches as a full or partial Ray Tracing.
The following members variables are evaluated :
freespace Loss @ fGHz PL() PathLoss (shoud be rename FS as free space) $
prdbmo : Received power in dBm .. math:P_{rdBm} =P_{tdBm} - L_{odB}
prdbmp : Received power in dBm .. math:P_{rdBm} =P_{tdBm} - L_{pdB}
snro : SNR polar o (H)
snrp : SNR polar p (H)
pylayers.antprop.loss.Losst pylayers.antprop.loss.PL
-
creategrid(mode='full', boundary=[], _fileini='')[source]¶ create a grid
- fullboolean
default (True) use all the layout area
- boundary(xmin,ymin,xmax,ymax)
if full is False the boundary argument is used
-
show(**kwargs)[source]¶ show coverage
- typstring
‘pr’ | ‘sinr’ | ‘capacity’ | ‘loss’ | ‘best’ | ‘egd’ | ‘ref’
grid : boolean polar : string
‘o’ | ‘p’
- bestboolean
draw best server contour if True
- fint
frequency index
- aint
access point index (-1 all access point)
>>> from pylayers.antprop.coverage import *
>>> C = Coverage()
>>> C.cover()
>>> f,a = C.show(typ='pr',figsize=(10,8))
>>> plt.show()
(Source code, png, hires.png, pdf)

>>> f,a = C.show(typ='best',figsize=(10,8))
>>> plt.show()
>>> f,a = C.show(typ='loss',figsize=(10,8))
>>> plt.show()

>>> f,a = C.show(typ='sinr',figsize=(10,8))
>>> plt.show()

pylayers.gis.layout.Layout.showG