!date
samedi 4 novembre 2017, 22:47:17 (UTC+0100)
Outdoor Coverage Knife-Edge Model
from pylayers.gis.ezone import *
import matplotlib.tri as tri
%matplotlib inline
We load a earth zone from its name in srtm file convention
z = Ezone('N48W002')
z.loadh5()
z.rebase()
# x,y,r,R,dem,LOS,h_earth,diff,fac,nu,numax,LFS,Ltot= z.cov(pc=(11000,45000),Ht=2,Hr=2,Rmax=10000)
pc=(11000,45000)
Rmax = 10000
fGHz=0.3
Ht = 2
Hr =2
K = 4/3.
Nphi = 45
Nr = 50
Then the coverage zone is defined
lmbda = 0.3/fGHz
phi  = np.linspace(0,2*np.pi,Nphi)[:,None]
r  = np.linspace(0,Rmax,Nr)[None,:]
 # cartesian
x  = pc[0] + r*np.cos(phi)
y  = pc[1] + r*np.sin(phi)
extent_c = np.array([x.min(),x.max(),y.min(),y.max()])
lon,lat = z.m(x,y,inverse=True)
# Triangulation
triang = tri.Triangulation(x.flatten(),y.flatten())
# back in lon,lat coordinates
triang.x = x
triang.y = y
rx = np.round((lon - z.extent[0]) / z.lonstep).astype(int)
ry = np.round((z.extent[3]-lat) / z.latstep).astype(int)
x.max()
21000.0
x.min()
1000.0
 # dem
dem = z.hgts[ry,rx]
dem.shape
(45, 50)
X=expand(x)
Y=expand(y)
X0=expand(pc[0]*np.ones((Nphi,Nr)))
Y0=expand(pc[1]*np.ones((Nphi,Nr)))
R=np.sqrt((X0-X)**2+(Y0-Y)**2)
R.shape
(45, 49, 50)
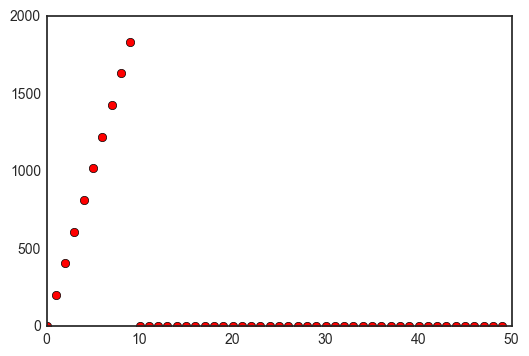
plt.plot(R[0,8,:],'or')
[<matplotlib.lines.Line2D at 0x7f12d07c5790>]
r
array([[     0.        ,    204.08163265,    408.16326531,    612.24489796,
           816.32653061,   1020.40816327,   1224.48979592,   1428.57142857,
          1632.65306122,   1836.73469388,   2040.81632653,   2244.89795918,
          2448.97959184,   2653.06122449,   2857.14285714,   3061.2244898 ,
          3265.30612245,   3469.3877551 ,   3673.46938776,   3877.55102041,
          4081.63265306,   4285.71428571,   4489.79591837,   4693.87755102,
          4897.95918367,   5102.04081633,   5306.12244898,   5510.20408163,
          5714.28571429,   5918.36734694,   6122.44897959,   6326.53061224,
          6530.6122449 ,   6734.69387755,   6938.7755102 ,   7142.85714286,
          7346.93877551,   7551.02040816,   7755.10204082,   7959.18367347,
          8163.26530612,   8367.34693878,   8571.42857143,   8775.51020408,
          8979.59183673,   9183.67346939,   9387.75510204,   9591.83673469,
          9795.91836735,  10000.        ]])
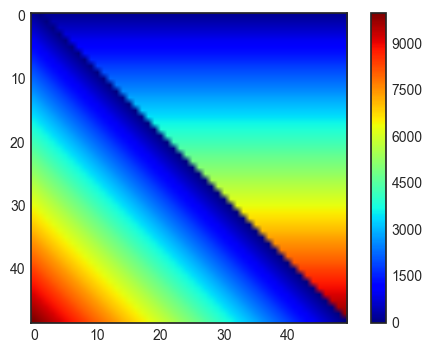
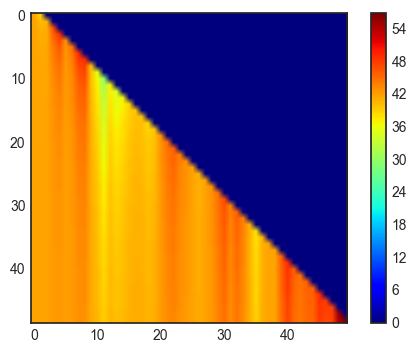
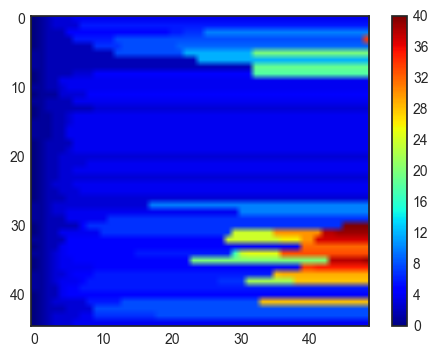
B=r.T[None,1:]-R
plt.imshow(B[0,:,:],cmap=plt.cm.jet,vmax=10000)
plt.colorbar()
<matplotlib.colorbar.Colorbar at 0x7f12d3d8af10>
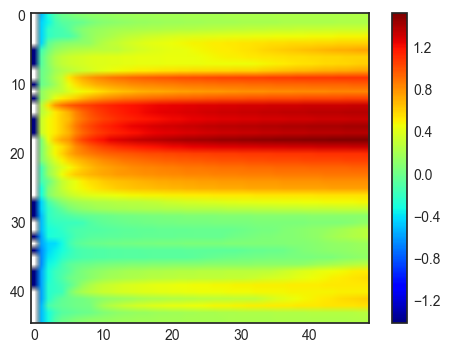
h_earth=(R*B)/(2*K*6375e3)
plt.imshow(h_earth[0,:,:],cmap=plt.cm.jet)
plt.colorbar()
<matplotlib.colorbar.Colorbar at 0x7f12d04f7510>
# ground height + antenna height
Ha = expand((Ht + z.hgts[ry[0,0],rx[0,0]])*np.ones((Nphi,Nr)))
Hb = expand(Hr + dem)
# LOS line
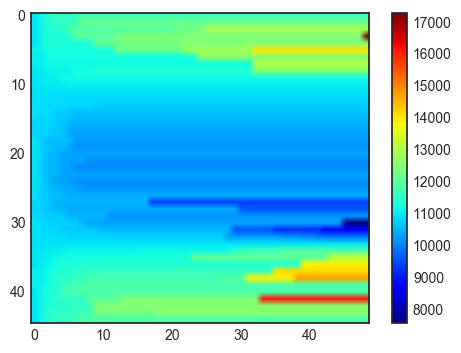
LOS = Ha+(Hb-Ha)*R/r.T[None,1:]
LOS.shape
(45, 49, 50)
plt.imshow(LOS[0,:,:],cmap=plt.cm.jet)
plt.colorbar()
<matplotlib.colorbar.Colorbar at 0x7f12d0350510>
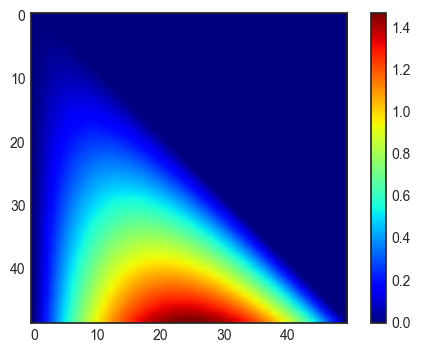
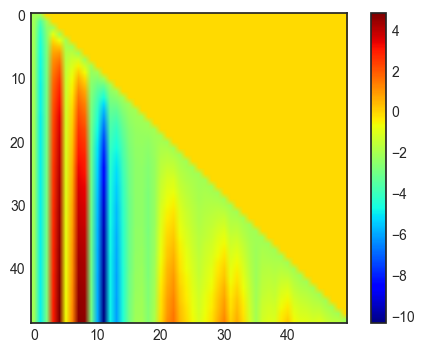
diff = expand(dem)+h_earth-LOS
plt.imshow(diff[0,:,:],cmap=plt.cm.jet)
plt.colorbar()
<matplotlib.colorbar.Colorbar at 0x7f12d0229b10>
fac = np.sqrt(2*r.T[None,1:]/(lmbda*R*B))
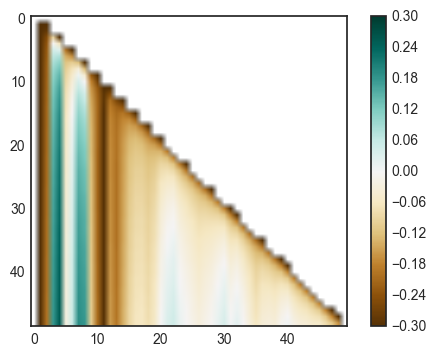
nu = diff*fac
#num,ind = maxloc(nu)
numax = np.nanmax(nu,axis=2)
u = np.where(numax>-0.7)
w = numax -0.1
L = np.zeros(w.shape)
L[u] = 6.9 + 20*np.log10(np.sqrt(w[u]**2+1)-w[u])
LFS = 32.4 + 20*np.log10(r[0,1:])+20*np.log10(fGHz)
Ltot = LFS+L
/home/uguen/anaconda2/lib/python2.7/site-packages/ipykernel_launcher.py:1: RuntimeWarning: divide by zero encountered in divide
  """Entry point for launching an IPython kernel.
/home/uguen/anaconda2/lib/python2.7/site-packages/ipykernel_launcher.py:1: RuntimeWarning: invalid value encountered in sqrt
  """Entry point for launching an IPython kernel.
/home/uguen/anaconda2/lib/python2.7/site-packages/ipykernel_launcher.py:2: RuntimeWarning: invalid value encountered in multiply
numax
array([[       -inf, -0.48965701, -0.28230755, ...,  0.24972005,
         0.25062671,  0.25151559],
       [       -inf, -0.41965701, -0.32272207, ...,  0.24151194,
         0.24269898,  0.24386059],
       [       -inf, -0.41965701, -0.20147851, ...,  0.35027767,
         0.35234104,  0.35434705],
       ...,
       [       -inf, -0.48965701, -0.12064947, ...,  0.55829095,
         0.56043653,  0.56251895],
       [       -inf, -0.48965701, -0.28230755, ...,  0.27134908,
         0.27288219,  0.27437836],
       [       -inf, -0.48965701, -0.28230755, ...,  0.24972005,
         0.25062671,  0.25151559]])
Ltot.shape
(45, 49)
LOS.shape
(45, 49, 50)
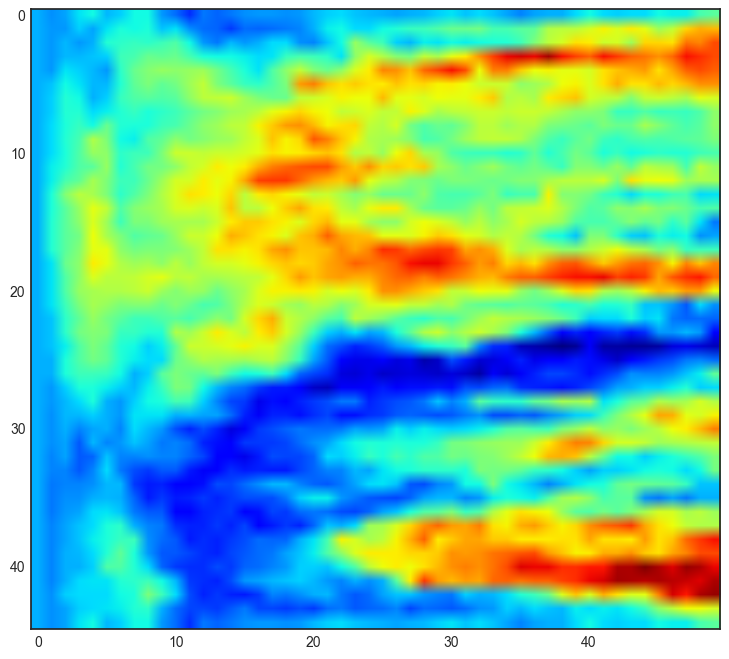
plt.figure(figsize=(15,8))
plt.imshow(dem,cmap=plt.cm.jet)
<matplotlib.image.AxesImage at 0x7f12d016aad0>
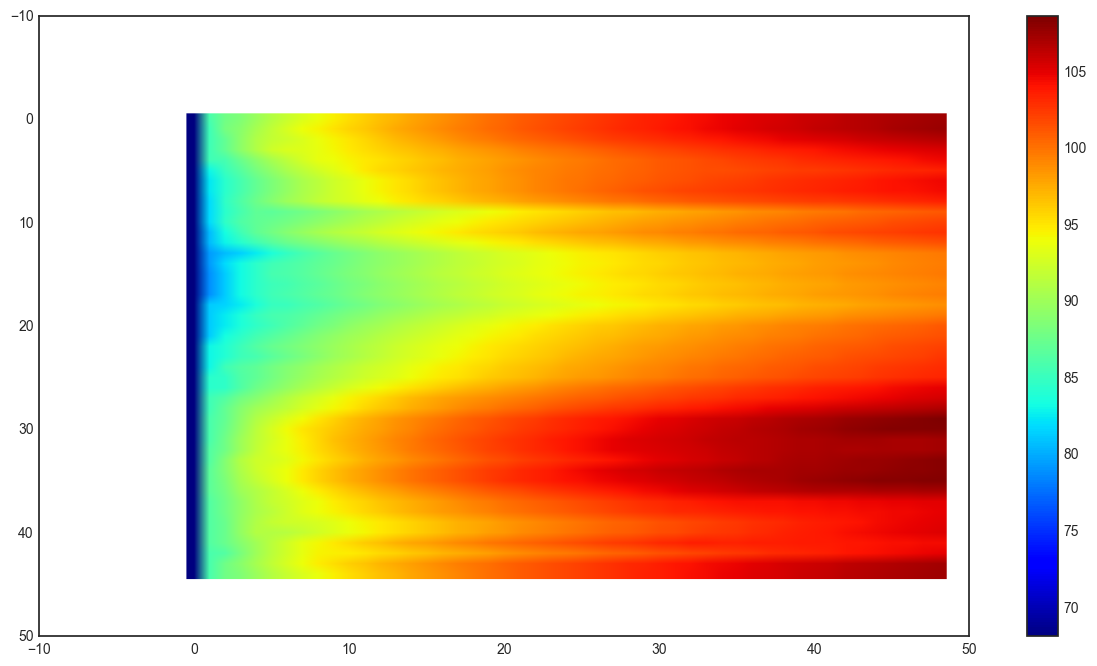
plt.figure(figsize=(15,8))
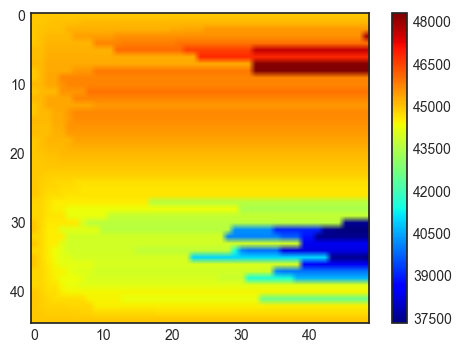
plt.imshow(Ltot,cmap=plt.cm.jet)
plt.colorbar()
plt.axis('auto')
(-10.0, 50.0, 50.0, -10.0)
u=np.argmax(nu,axis=2)
plt.imshow(nu[0,:,:],vmin=-0.3,vmax=0.3,cmap=plt.cm.BrBG)
plt.colorbar()
<matplotlib.colorbar.Colorbar at 0x7f12d048f650>
#plt.plot(h_earth[0,30,:])
#plt.plot(LOS[0,30,:])
#plt.plot(diff[0,30,:])
#plt.plot(dem[0,:])
#plt.plot(nu[0,30,:])
#plt.ylim(0,1)
#plt.plot(8,nu[0,30,8],'or')
nu.shape
(45, 49, 50)
numax2=np.nanmax(nu,axis=2)
numax2.shape
(45, 49)
plt.imshow(numax2,cmap=plt.cm.jet,vmin=-1.4)
plt.colorbar()
<matplotlib.colorbar.Colorbar at 0x7f12ce6d6c50>
imax indique le point d’engagement maximum
imax=np.nanargmax(nu,axis=2)
imax
array([[ 0,  1,  2, ...,  4,  4,  4],
       [ 0,  1,  2, ...,  6,  6,  6],
       [ 0,  1,  2, ..., 10, 10, 10],
       ...,
       [ 0,  1,  2, ...,  8,  8,  8],
       [ 0,  1,  2, ...,  8,  8,  8],
       [ 0,  1,  2, ...,  4,  4,  4]])
plt.imshow(imax,cmap=plt.cm.jet)
plt.colorbar()
<matplotlib.colorbar.Colorbar at 0x7f12ce5a34d0>

Recherche des coordonn??es du point diffractant pour toutes les directions et pour tous les ranges.
imax.shape
(45, 49)
iphi = np.arange(Nphi)[:,None]
it = np.arange(0,Nr-1)[None,:]
plt.imshow(imax,cmap=plt.cm.jet)
plt.colorbar()
<matplotlib.colorbar.Colorbar at 0x7f12ce47cc50>
for k in range(2,Nphi-1):
    for l in range(1,Nr-1):
        if imax[k,l]!=0:
            t1 = np.arange(0,1,imax[k,l])
            t2 = np.arange(1,0,Nr-imax[k,l])
            t = np.hstack((t1,t2))
XM = x[iphi,imax[iphi,it]]
YM = y[iphi,imax[iphi,it]]
XM.shape
(45, 49)
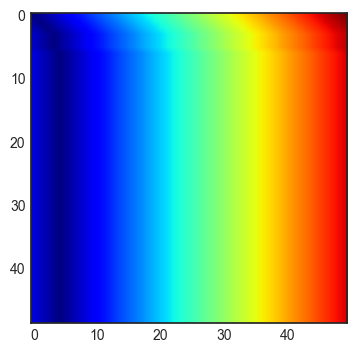
plt.imshow(XM,cmap=plt.cm.jet)
plt.colorbar()
<matplotlib.colorbar.Colorbar at 0x7f12ce2e8150>
plt.imshow(YM,cmap=plt.cm.jet)
plt.colorbar()
<matplotlib.colorbar.Colorbar at 0x7f12ce1bd990>
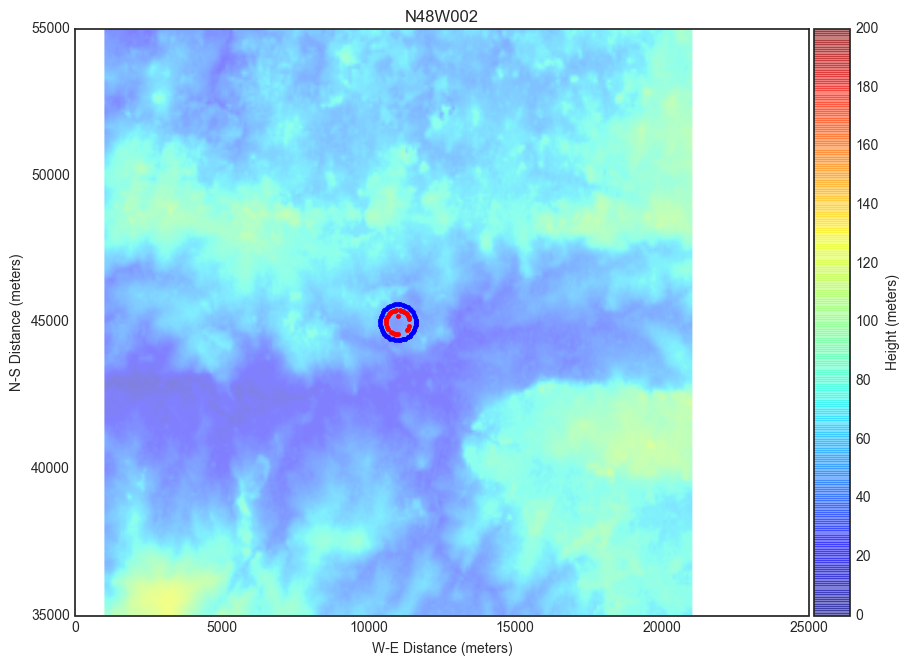
plt.figure(figsize=(20,20))
ik = 3
#plt.tripcolor(triang,dem.flatten())
f,a,d=z.show(coord='cartesian',extent=extent_c)
a.plot(XM[:,ik],YM[:,ik],'.r')
a.plot(x[:,ik],y[:,ik],'.b')
#plt.axis('equal')
[<matplotlib.lines.Line2D at 0x7f12ce0799d0>]
<matplotlib.figure.Figure at 0x7f12ce6540d0>
RF=np.sqrt((XM[...,None]-x[:,None,:])**2+(YM[...,None]-y[:,None,:])**2)
plt.imshow(RF[0,:,:],cmap=plt.cm.jet)
<matplotlib.image.AxesImage at 0x7f12cdec30d0>
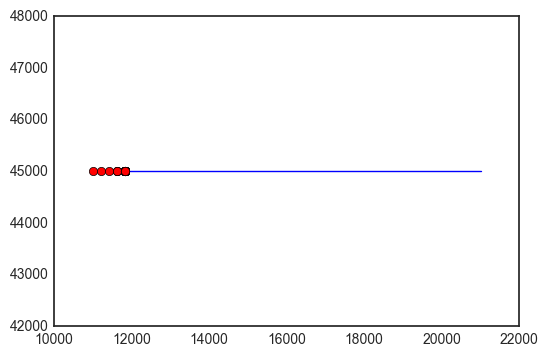
plt.plot(x[0,:],y[0,:])
plt.plot(XM[0,:],YM[0,:],'or')
[<matplotlib.lines.Line2D at 0x7f12cde5cf50>]
RF.shape
(45, 49, 50)
P=RF[:,0:-1,:]-RF[:,1:,:]
import numpy as np
import time
import pdb
from numba import jit
@jit
def splitMDA(imax):
    Nphi,Nl = imax.shape
    N = Nphi*Nl*(Nl+1)
    Ntot = imax.sum()
    u = np.empty((3,Ntot),dtype=int)
    #u1 = np.empty(Ntot)
    #u2 = np.empty(Ntot)
    v = np.empty((3,N-Ntot),dtype=int)
    #v1 = np.empty(N-Ntot)
    #v2 = np.empty(N-Ntot)
    indu = 0
    indv = 0
    for ip in range(Nphi):
        for il in range(Nl):
            for k in range(Nr):
                if k<imax[ip,il]:
                    u[0,indu] = ip
                    u[1,indu] = il
                    u[2,indu] = k
                    indu = indu+1
                else:
                    v[0,indv] = ip
                    v[1,indv] = il
                    v[2,indv] = k
                    indv = indv+1
    #return (u0,u1,u2),(v0,v1,v2)
    return u,v

tic = time.time()
u,v = splitMDA(imax)
toc=time.time()
print toc-tic
0.395106077194
plt.plot(RF[0,4,:])
[<matplotlib.lines.Line2D at 0x7f12c57eb950>]
UL=np.zeros(RF.shape)
UR=np.zeros(RF.shape)
UL[(u[0,:],u[1,:],u[2,:])]=RF[(u[0,:],u[1,:],u[2,:])]
UR[(v[0,:],v[1,:],v[2,:])]=RF[(v[0,:],v[1,:],v[2,:])]
plt.plot(UL[0,4,:])
plt.plot(UR[0,4,:],'r')
[<matplotlib.lines.Line2D at 0x7f12cde65490>]
import numpy as np
import time
import pdb
from numba import jit
@jit
def splitMDA(imax):
    Nphi,Nl = imax.shape
    N = Nphi*Nl*(Nl+1)
    Ntot = imax.sum()
    u = np.empty((3,Ntot),dtype=int)
    #u1 = np.empty(Ntot)
    #u2 = np.empty(Ntot)
    v = np.empty((3,N-Ntot),dtype=int)
    #v1 = np.empty(N-Ntot)
    #v2 = np.empty(N-Ntot)
    indu = 0
    indv = 0
    for ip in range(Nphi):
        for il in range(Nl):
            for k in range(Nr):
                if k<imax[ip,il]:
                    u[0,indu] = ip
                    u[1,indu] = il
                    u[2,indu] = k
                    indu = indu+1
                else:
                    v[0,indv] = ip
                    v[1,indv] = il
                    v[2,indv] = k
                    indv = indv+1
    #return (u0,u1,u2),(v0,v1,v2)
    return u,v

tic = time.time()
u,v = splitMDA(imax)
toc=time.time()
print toc-tic
0.28248000145
import numpy as np
import time
import pdb
from numba import jit
#@jit
def cover(dem,X,Y,Ha,Hb,fGHz):
Nphi,Nl = dem.shape
#pdb.set_trace()
print Nphi,Nl
L = np.zeros((Nphi,Nl,Nl+1))
for ip in range(Nphi):
for il in range(Nl):
uk = range(1,il+2)
z = np.empty(len(uk))
for k in uk:
x = X[ip,:k]
y = Y[ip,:k]
z[:k] = dem[ip,:k]
d = np.sqrt((x-x[0])**2+(y-y[0])**2)
u = np.arange(len(z))/(len(z)-1.0)
z[0] = z[0] + Ha
z[-1] = z[-1] + Hb
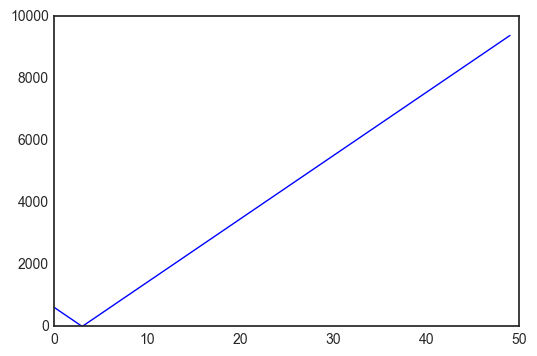
plt.plot(d,z)
L[ip,il,k]=interv(z,d,fGHz,0,0)
return(L)
#@jit
def interv(z,d,fGHz,L,depth):
lmbda = 0.3/fGHz
depth = depth+1
if depth <3:
if len(z)>3:
u = np.arange(len(z))/(len(z)-1.0)
l = (z[0])*(1-u)+(z[-1])*u
h = z[1:-1]-l[1:-1]
nu = h*np.sqrt((2/lmbda)*(1/d[1:-1]+1/(d[-1]-d[1:-1])))
imax = np.nanargmax(nu)
numax = nu[imax]
else:
numax = -10
if numax>-0.78:
w = numax -0.1
L = L + 6.9 + 20*np.log10(np.sqrt(w**2+1)+w)
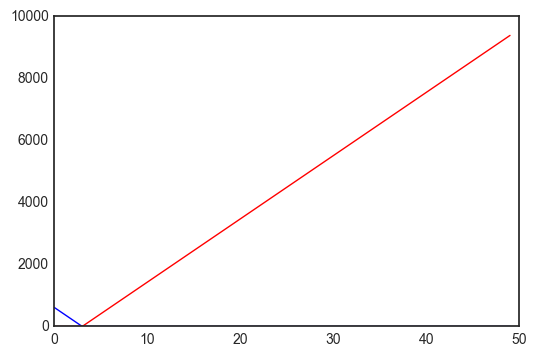
z1 = z[0:imax]
d1 = d[0:imax]
Ll = interv(z1,d1,fGHz,0,depth)
z2 = z[imax:]
d2 = d[imax:]
Lr = interv(z2,d2,fGHz,0,depth)
L = L+Lr+Ll
return(L)
tic = time.time()
L=cover(dem,x,y,1,1,2)
toc=time.time()
print toc-tic
45 50
/home/uguen/anaconda2/lib/python2.7/site-packages/ipykernel_launcher.py:20: RuntimeWarning: invalid value encountered in divide
2.30528688431
x
array([[ 11000.        ,  11204.08163265,  11408.16326531, ...,
         20591.83673469,  20795.91836735,  21000.        ],
       [ 11000.        ,  11202.00437589,  11404.00875179, ...,
         20494.20566702,  20696.21004292,  20898.21441881],
       [ 11000.        ,  11195.81489257,  11391.62978515, ...,
         20203.299951  ,  20399.11484357,  20594.92973614],
       ...,
       [ 11000.        ,  11195.81489257,  11391.62978515, ...,
         20203.299951  ,  20399.11484357,  20594.92973614],
       [ 11000.        ,  11202.00437589,  11404.00875179, ...,
         20494.20566702,  20696.21004292,  20898.21441881],
       [ 11000.        ,  11204.08163265,  11408.16326531, ...,
         20591.83673469,  20795.91836735,  21000.        ]])
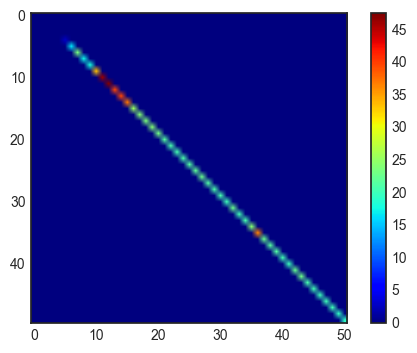
plt.imshow(L[0,:,:],cmap=plt.cm.jet)
plt.colorbar()
<matplotlib.colorbar.Colorbar at 0x7f12be98b610>